This is one in a series of posts on the Fujifilm GFX 100. You should be able to find all the posts about that camera in the Category List on the right sidebar, below the Articles widget. There’s a drop-down menu there that you can use to get to all the posts in this series; just look for “GFX 100”.
I’ve talked anecdotally about the GFX 100’s face detection feature, and now I’ll get quantitative.
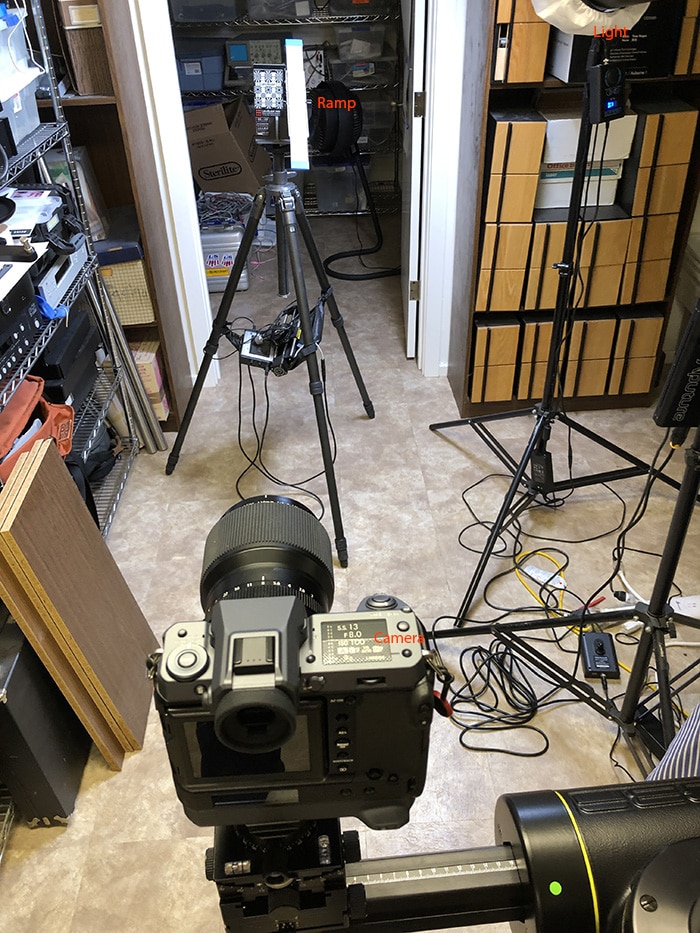
Here’s the setup I use in general for these kinds of tests:
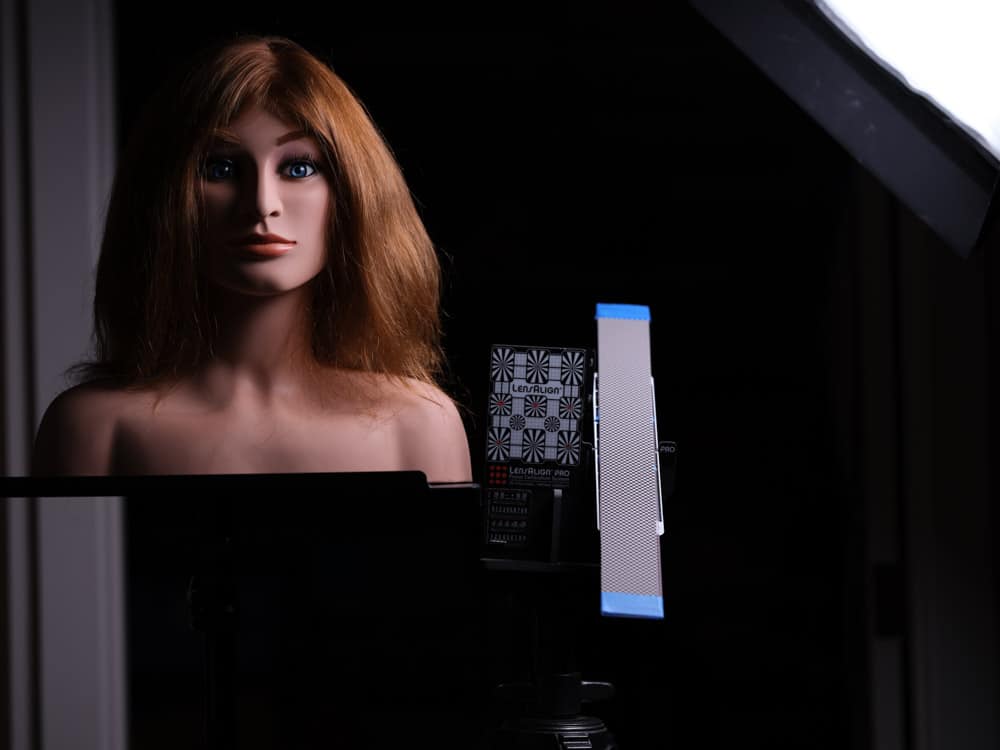
The checkerboard ramp allows a Matlab computer program that I wrote to calculate the focus distance. I usually use a simple target like the one you see above, or sometimes replace the easy-to-focus one with something a bit more difficult. But to properly test eye-detection AF, I need a three dimensional target. Here’s a camera’s-eye-view of the one I used for this test:
My subject is creepy, but she can hold still for a long time, never complains, and never blinks.
I used the 110 mm f/2 lens at a distance of 2 meters, with AFS-S, focus priority, and left eye detection turned on (the camera thinks in terms of subject rand and left instead of camera right and left). I shot at 1/3 stop increments from f/2 through f/5.6, ten shots at each f-stop, and analysed the statistics of the results in Matlab.
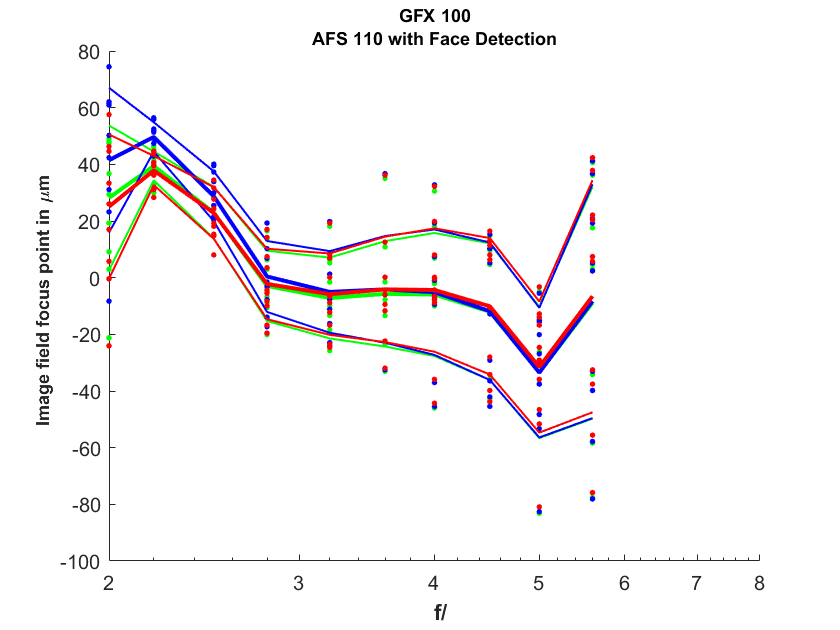
Here are the focal-plane errors measured at the sensor in micrometers (um):
Front focus in the object field is indicated with negative y-axis numbers. Back-focus is show with positive numbers. I’ve plotted results for all three Adobe RGB color planes in their respective colors. The fact that they’re right on top of each other from f/2.8 through f/5.6 is an indication of the superb longitudinal chromatic aberration (LoCA) performance of this lens. Just as with the regular focusing modes, the camera does not adequately compensate for the focus shift caused by the 110/2’s spherical aberration near wide open. The heavy lines are the average of the 10 shots per f-stop, and the narrower lines are one standard deviation above and below the average. You can see the data for each exposure, too, it’s plotted as dots.
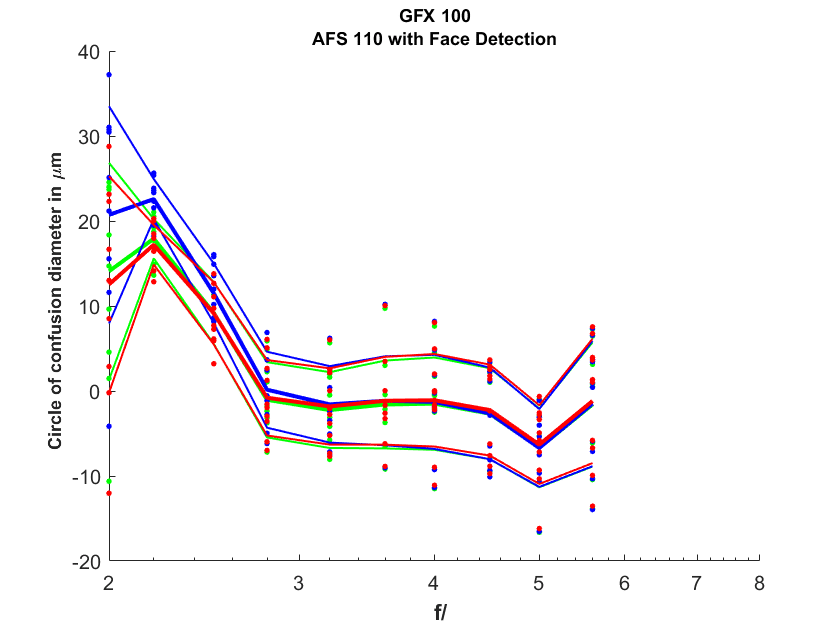
To get an idea of what this means to photographers, I’ll convert it to a metric for defocus blur. The metric I’ve chosen is the diameter of the defocus-induced circle of confusion (CoC) in micrometers:
Form f/2.8 on up, this is pretty darned good performance, although it might not be so for landscape work. About 68% of the shots will fall between the two onoe-standard deviation lines, and that means that they will have blur circles of about 2 pixel pitches or less.
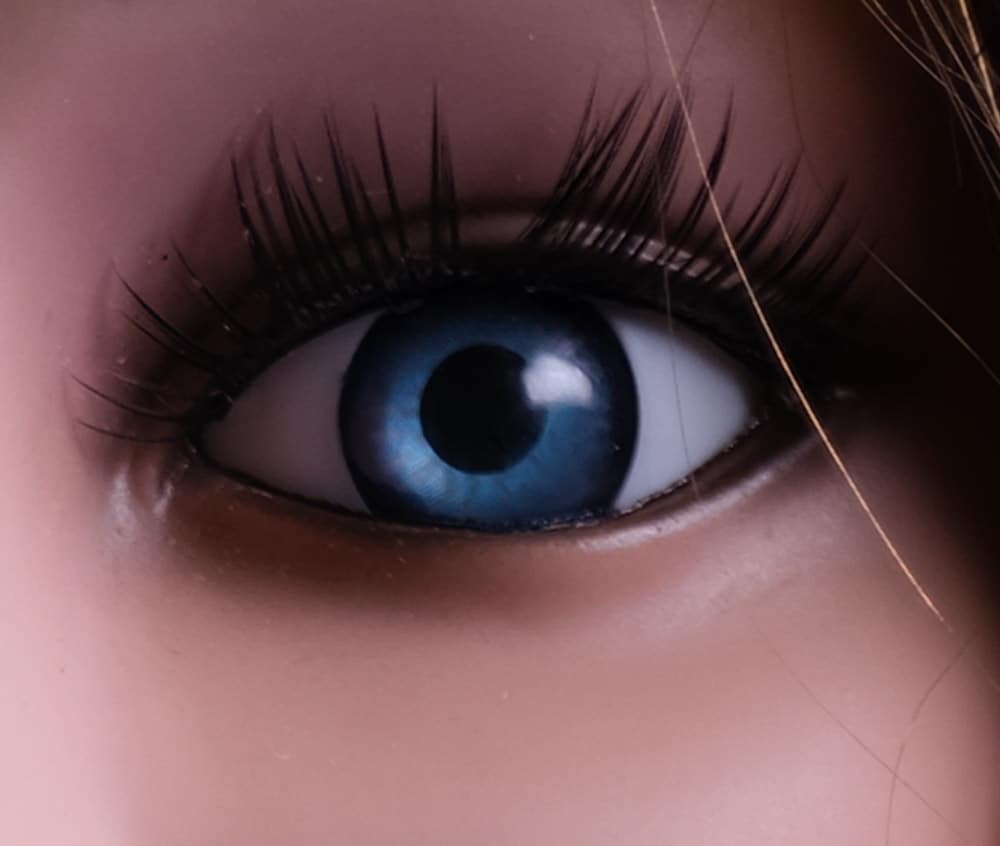
Even the f/2 shots aren’t all that far off. I’ll show you some crops, magnified to about 150%, to give you a better idea.
This is one of the worst f/2 shots:
And this is one of the best f/2 shots:
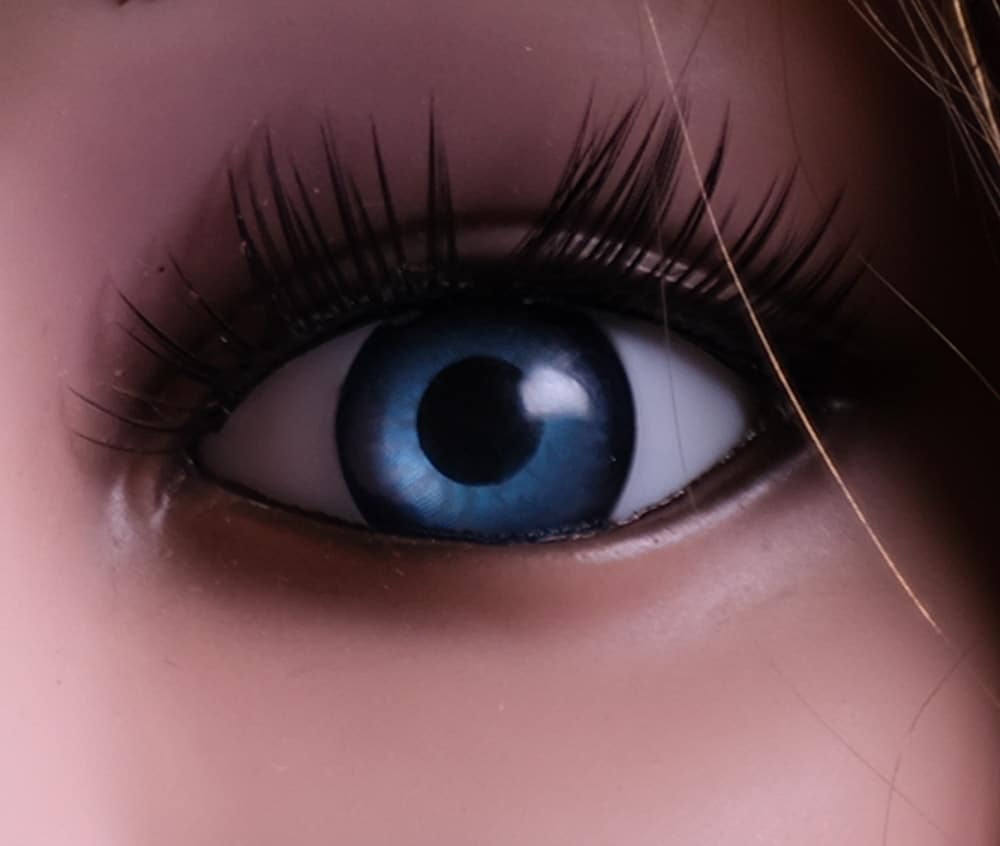
Neither one is really bad.
For comparison, here is a well-focused — on the middle of the iris — f/4 image:
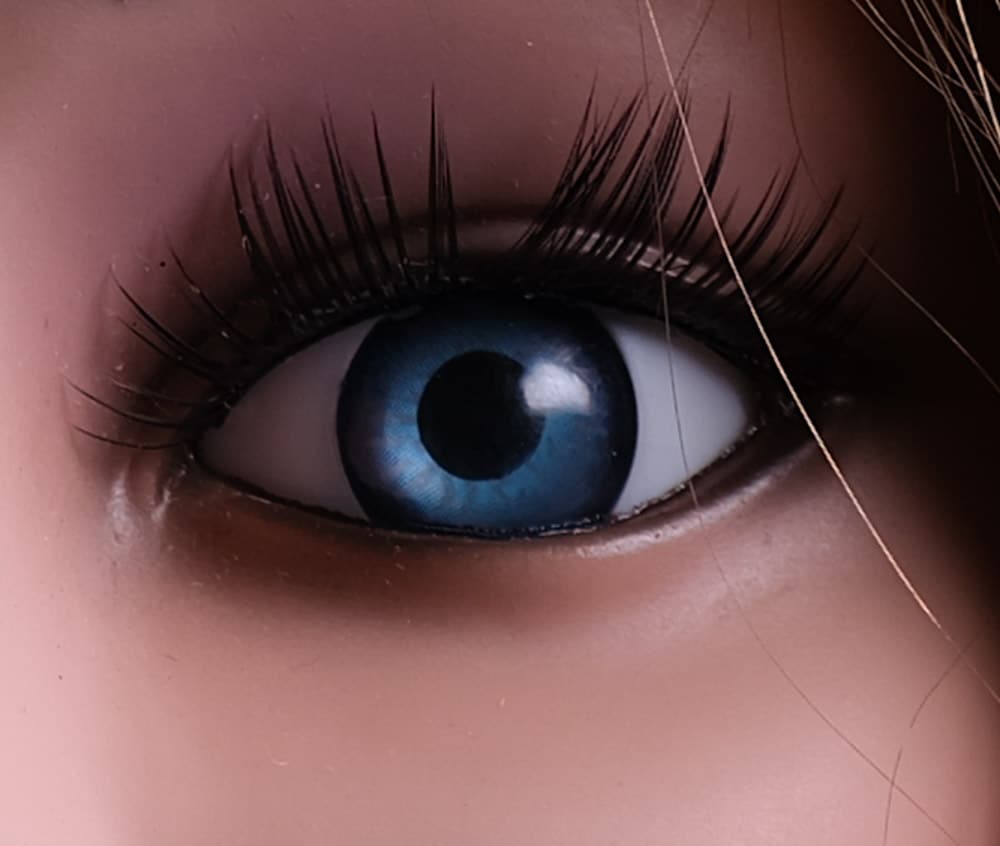
By the way, the sharpening for all of the above was set to amount = 40, radius = 1, and detail = 25, which is the Lightroom default. That’s too sharp for general work, but makes it easier to see misfocusing.
I am impressed.
Leave a Reply