• site home
  • blog home
  • galleries
  • contact
  • underwater
  • the bleeding edge

the last word

Photography meets digital computer technology. Photography wins -- most of the time.

You are here: Home / GFX 100 / GFX 100 self-heating read noise and EDR

GFX 100 self-heating read noise and EDR

September 10, 2019 JimK 5 Comments

This is one in a series of posts on the Fujifilm GFX 100. You should be able to find all the posts about that camera in the Category List on the right sidebar, below the Articles widget. There’s a drop-down menu there that you can use to get to all the posts in this series; just look for “GFX 100”.

I received a request to look at the effects of self-heating of the Fujifilm GFX 100 on the read noise. In the past, with MILCs without IBIS have had very little self-heating effects, but some Sony’s with IBIS have had a bit more, probably due to less-effective heat-sinking because of the isolation between the sensor and the chassis.

Using the internal intervalometer, I made 120 1-second exposures 30 seconds apart, with the LCD enabled. The camera blanks the display for part of each 30-second cycle, and may not be scanning the sensor during that time. However, at the end of an hour, the camera had gone through most of one of the installed batteries, and the body was quite warm when I picked it up, indicating that there was considerable self-heating. Fuji does not report camera temperature in the EXIF data, unlike Sony, which in this case is a shame.

I measured the rms read noise in counts (or Data Numbers, if you prefer) for a 600×600 patch offset just enough from the center of the frame so that it avoided the center column.

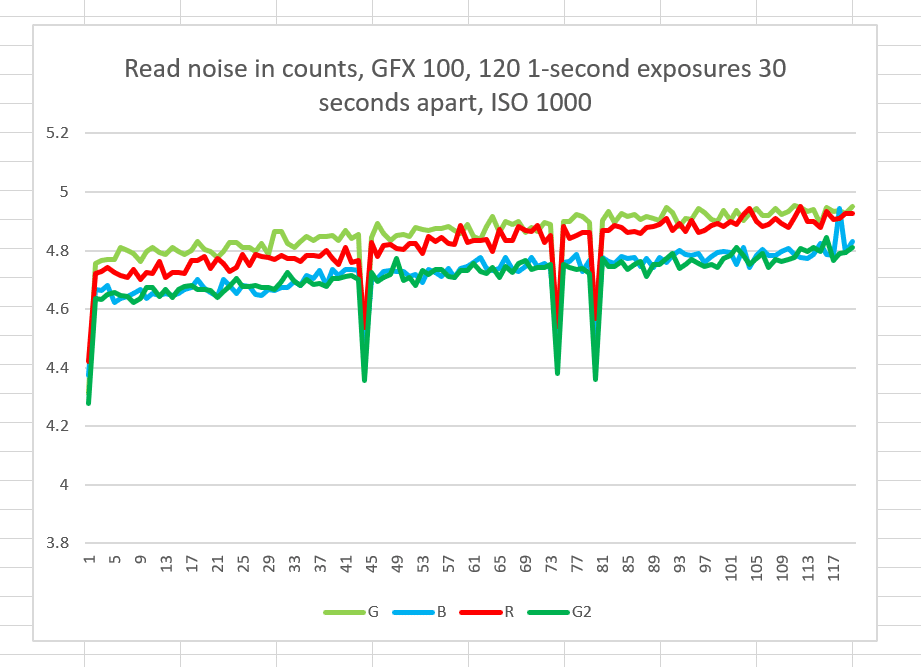
There is a very small gradual increase in the noise, amounting to about 0.2 counts. This is nothing to worry about.

The flip side of noise is engineering dynamic range (EDR) at a SNR of 0. Here’s what that looks like:

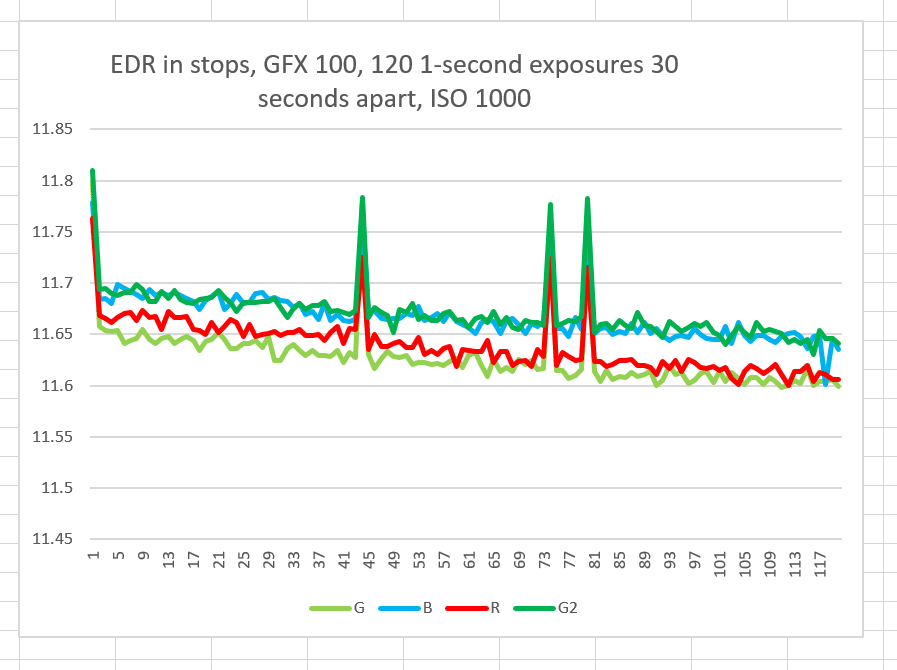
About a 0.05 stop change. Again, this is benign.

What caused the four outliers? I have no idea.

GFX 100

← Dot gain in the Epson P800 Epson P800 720 ppi MTF curves →

Comments

  1. Frans Waterlander says

    September 13, 2019 at 2:44 pm

    Thanks for running this test, Jim!

    It looks like self heating isn’t an issue for this camera. I do have some observations:
    – You measured an EDR of about 11.7, while Bill Claff measured a PDR of 12.3; isn’t PDR supposed to be lower than EDR? It would hope that the manufacturing process unit-to-unit variations would not explain this difference
    – If the sensor would not be active during part of the 30 second cycle, you could improve the test by taking fewer shots
    – What would be worse: using the monitor or EVF, photography mode or video mode?
    – It doesn’t look like equilibrium was reached after one hour

    While these results are encouraging for this particular, expensive, $10,000 camera , they don’t tell us to what to expect for other cameras. IMHO, whenever dynamic range and other image quality attributes of cameras with Live View are stated, it should be mentioned under what conditions: initially at room temperature when the camera has just been switched on. And ideally, if it makes enough of a difference, what happens to those attributes over time when the camera self heats. And if you really want to go all-out, what happens at ambient temperatures other than room temperature.

    Reply
    • JimK says

      September 13, 2019 at 2:51 pm

      – You measured an EDR of about 11.7, while Bill Claff measured a PDR of 12.3; isn’t PDR supposed to be lower than EDR?

      Look at the ISO settings for both tests.

      Reply
      • Frans Waterlander says

        September 13, 2019 at 10:34 pm

        Agreed on the EDR/PDR issue. What about the others?

        Reply
        • JimK says

          September 14, 2019 at 7:15 am

          The effects are so small I don’t want to spend any more time quantifying them or tweaking the test procedure.

          Reply
          • Frans Waterlander says

            September 14, 2019 at 11:02 am

            I totally agree with you. Thanks again for doing the testing!

            Reply

Leave a Reply Cancel reply

Your email address will not be published. Required fields are marked *

May 2025
S M T W T F S
 123
45678910
11121314151617
18192021222324
25262728293031
« Apr    

Articles

  • About
    • Patents and papers about color
    • Who am I?
  • How to…
    • Backing up photographic images
    • How to change email providers
    • How to shoot slanted edge images for me
  • Lens screening testing
    • Equipment and Software
    • Examples
      • Bad and OK 200-600 at 600
      • Excellent 180-400 zoom
      • Fair 14-30mm zoom
      • Good 100-200 mm MF zoom
      • Good 100-400 zoom
      • Good 100mm lens on P1 P45+
      • Good 120mm MF lens
      • Good 18mm FF lens
      • Good 24-105 mm FF lens
      • Good 24-70 FF zoom
      • Good 35 mm FF lens
      • Good 35-70 MF lens
      • Good 60 mm lens on IQ3-100
      • Good 63 mm MF lens
      • Good 65 mm FF lens
      • Good 85 mm FF lens
      • Good and bad 25mm FF lenses
      • Good zoom at 24 mm
      • Marginal 18mm lens
      • Marginal 35mm FF lens
      • Mildly problematic 55 mm FF lens
      • OK 16-35mm zoom
      • OK 60mm lens on P1 P45+
      • OK Sony 600mm f/4
      • Pretty good 16-35 FF zoom
      • Pretty good 90mm FF lens
      • Problematic 400 mm FF lens
      • Tilted 20 mm f/1.8 FF lens
      • Tilted 30 mm MF lens
      • Tilted 50 mm FF lens
      • Two 15mm FF lenses
    • Found a problem – now what?
    • Goals for this test
    • Minimum target distances
      • MFT
      • APS-C
      • Full frame
      • Small medium format
    • Printable Siemens Star targets
    • Target size on sensor
      • MFT
      • APS-C
      • Full frame
      • Small medium format
    • Test instructions — postproduction
    • Test instructions — reading the images
    • Test instructions – capture
    • Theory of the test
    • What’s wrong with conventional lens screening?
  • Previsualization heresy
  • Privacy Policy
  • Recommended photographic web sites
  • Using in-camera histograms for ETTR
    • Acknowledgments
    • Why ETTR?
    • Normal in-camera histograms
    • Image processing for in-camera histograms
    • Making the in-camera histogram closely represent the raw histogram
    • Shortcuts to UniWB
    • Preparing for monitor-based UniWB
    • A one-step UniWB procedure
    • The math behind the one-step method
    • Iteration using Newton’s Method

Category List

Recent Comments

  • JimK on Goldilocks and the three flashes
  • DC Wedding Photographer on Goldilocks and the three flashes
  • Wedding Photographer in DC on The 16-Bit Fallacy: Why More Isn’t Always Better in Medium Format Cameras
  • JimK on Fujifilm GFX 100S II precision
  • Renjie Zhu on Fujifilm GFX 100S II precision
  • JimK on Fuji 20-35/4 landscape field curvature at 23mm vs 23/4 GF
  • Ivo de Man on Fuji 20-35/4 landscape field curvature at 23mm vs 23/4 GF
  • JimK on Fuji 20-35/4 landscape field curvature at 23mm vs 23/4 GF
  • JimK on Fuji 20-35/4 landscape field curvature at 23mm vs 23/4 GF
  • Ivo de Man on Fuji 20-35/4 landscape field curvature at 23mm vs 23/4 GF

Archives

Copyright © 2025 · Daily Dish Pro On Genesis Framework · WordPress · Log in

Unless otherwise noted, all images copyright Jim Kasson.