This is one in a series of posts on the Fujifilm GFX 100S. You should be able to find all the posts about that camera in the Category List on the right sidebar, below the Articles widget. There’s a drop-down menu there that you can use to get to all the posts in this series; just look for “GFX 100S”.
I’ve been refining my modulation transfer function calculation protocol, with the idea of eventually testing all of the Fujifilm GF lenses on-axis at the same magnification. The protocol is capable of measuring sharpness (MTF50 only, for now), longitudinal chromatic aberration (LoCA), and focus shift with aperture.
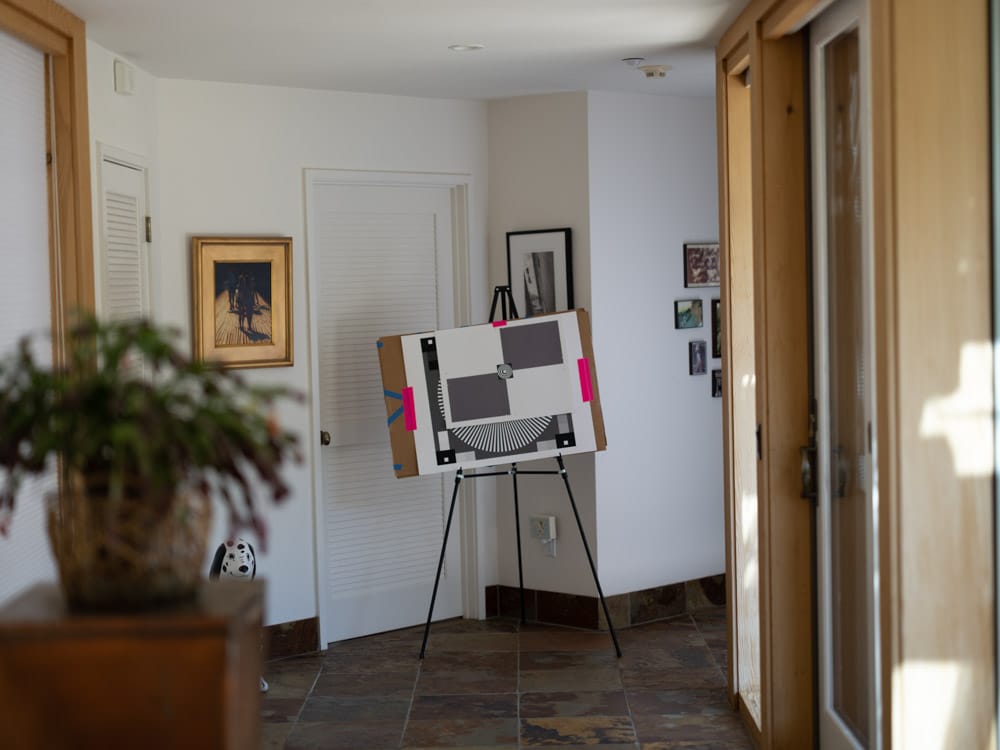
I’m using a low-contrast inkjet-printed slanted edge target.
Here’s my current test protocol:
- RRS carbon fiber legs
- C1 head
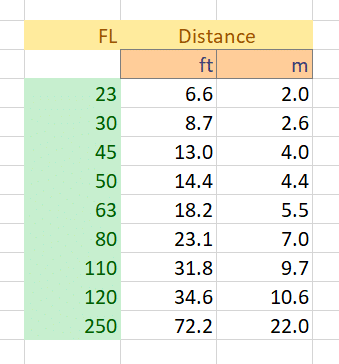
- Target distance 9.7 meters for a 110 mm lens
- ISO 100
- Electronic shutter
- 10-second self timer
- f/2 through f/11 in whole-stop steps
- Exposure time set by camera in A mode
- Focus bracketing, step size 1, 80 exposures
- Initial focus well short of target
- Convert RAF to DNG using Adobe DNG Converter
- Extract raw mosaics with dcraw (I’ll change this to libraw and drop the DNG conversion when I get the chance, but the Matlab program that controls all this is written for dcraw)
- Extract slanted edge for each raw plane in a Matlab program the Jack Hogan originally wrote, and that I’ve been modifying for years.
- Analyze the slanted edges and produce MTF curves using MTF Mapper (great program; thanks, Frans)
- Fit curves to the MTF Mapper MTF50 values in Matlab
- Correct for systematic GFX focus bracketing inconsistencies
- Analyze and graph in Matlab
Here’s the target distance table:
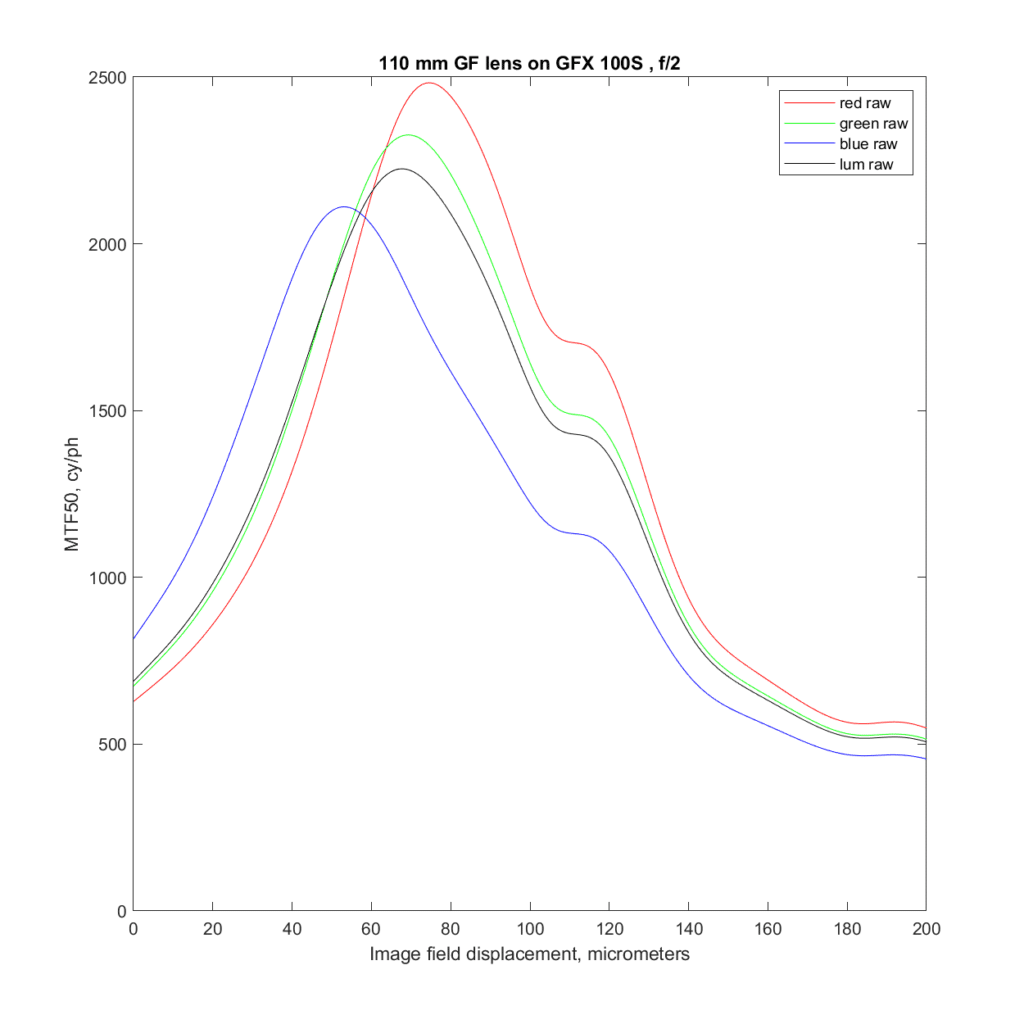
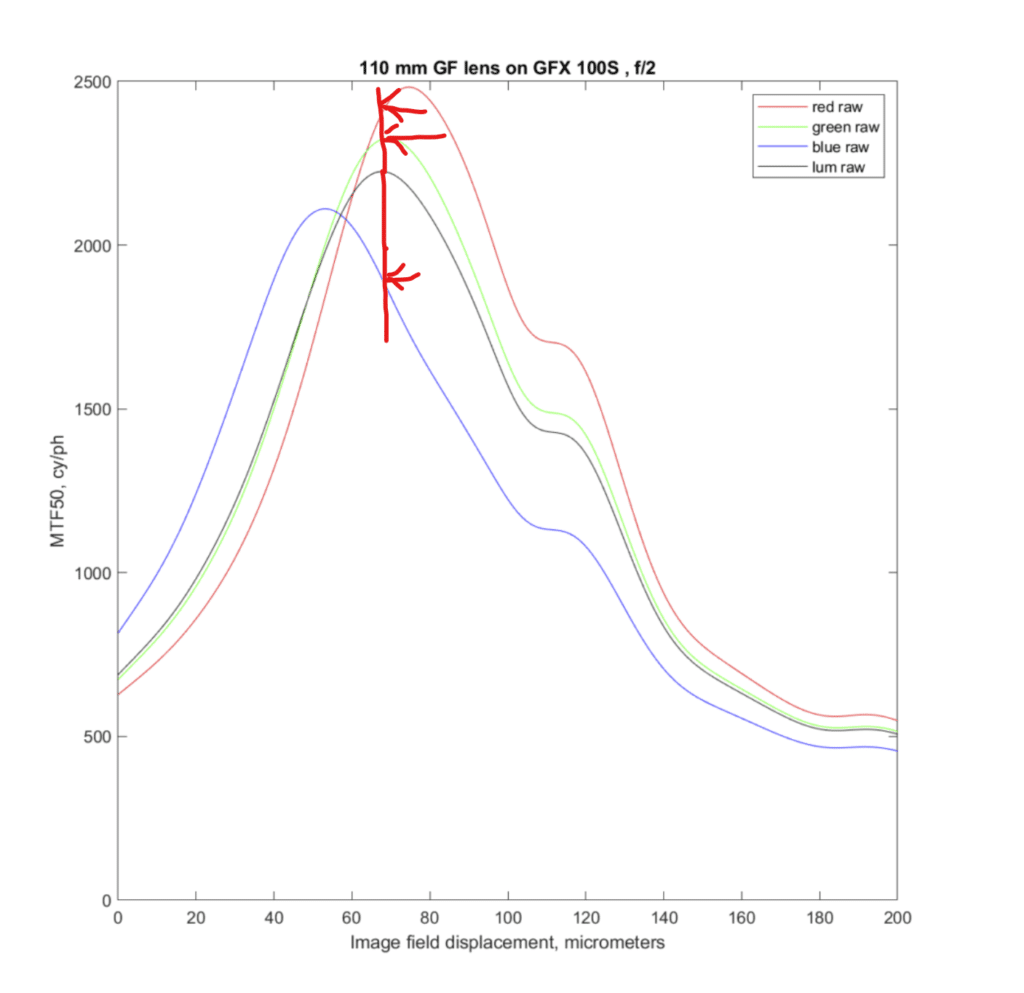
Here’s a graph of the MTF50 in cycles per picture height (cy/ph) wide open:
Let me decode the chart. The vertical axis is MTF50 in cycles/picture height. The horizontal axis is displacement of the sensor die (image field) focal plane in micrometers. In the object field (the subject side of the lens) the left side of the chart represents front-focusing, and the right side of the graph represents back focusing. There are four lines plotted. The red on is the red raw channel, the blue one is the blue raw channel, and the green one is the average of the two green raw channels. The black line is a combination of the other three lines after white balancing to the target. It can be considered a stand-in for a luminance MTF50 curve. The white-balanced (WB) raw curve peaks at about the same place as the green curve, since green is the main component of the WB raw curve. However, the peak of the WB raw curve is lower than the green curve, because the red and blue curves don’t peak in the same place as the green curve. That is the result of the lens’ longitudinal chromatic aberration (LoCA).
The height of the black curve at its peak is the best estimate of the sharpness of the lens that can be derived from this chart.
Ignore the bump on the right side of all the curves at about 120 um of displacement. That is the result of a glitch in the GFX focus bracketing feature. I can correct for the systematic errors that that subsystem makes, but not for the purely random ones. Luckily, it didn’t occur near the peaks.
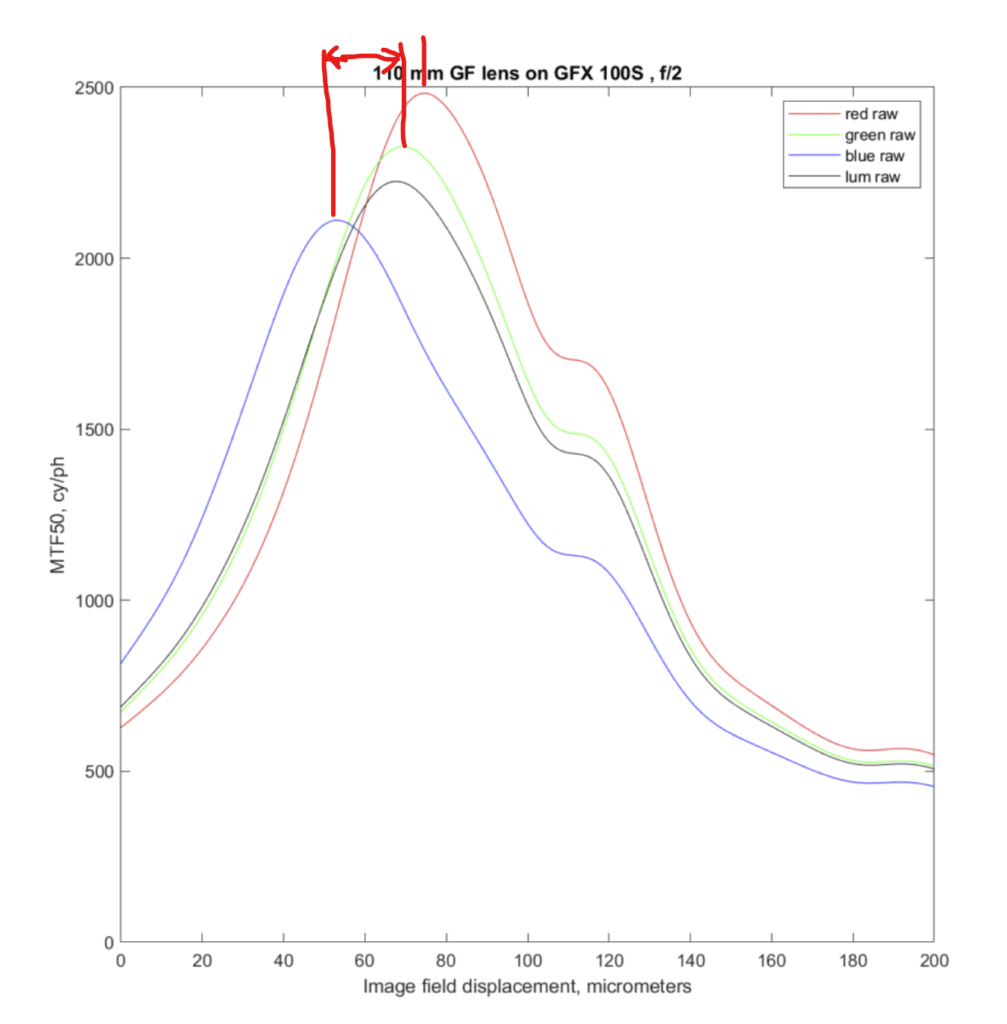
Here are two ways to turn the chart above into a quantitative descriptor of LoCA.
The first is to think like a lens designer and consider how the focal planes for the red, green, and blue raw channels relate to each other in the camera (image field) or at the subject (object field). If you look at the horizontal separation of the peaks above you can see that the blue plane is front-focused with respect to the green plane, and that the red place is back-focused when compared to the green plane, but by a lesser amount. The amount of the shift can be converted into the circles of confusion diameters (CoCs) when the camera is focused so that the green plane is sharp. There is about a 20 um displacement difference between the blue and the green plane, so the CoC for the blue plane with be 20 um/ 2 or 10 um. Thus there will be a faint blue outline of properly focused point sources.
The other way to look at these charts and ascertain the effects of LoCA is to look at all three raw panes at the peak of the WB raw lane MTF50 curve. You can see that the red channel is slightly sharper there, and by how much (a trivial amount), and you can see that the blue channel is blurrier there.
I I had to choose between the two ways of looking at the chart, I’d pick the upper one.
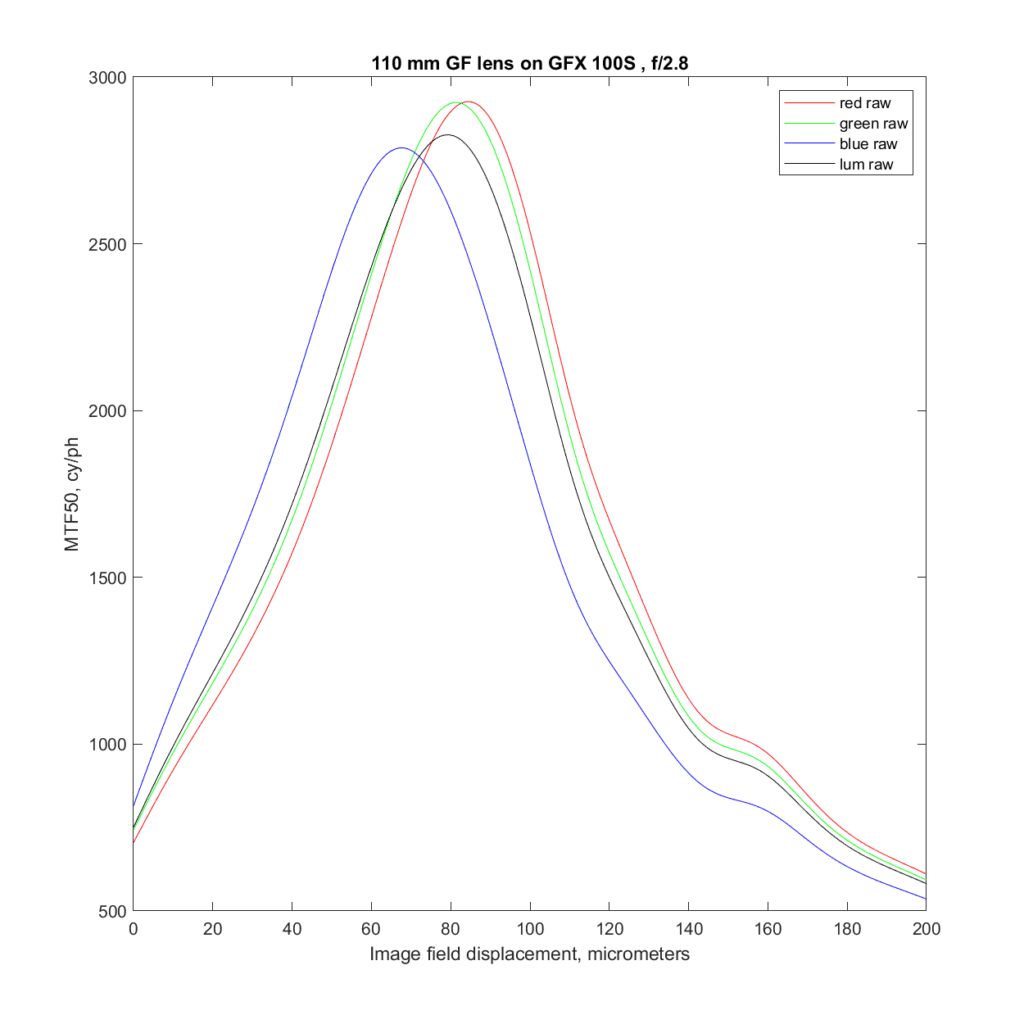
Here’s the same lens at f/2.8:
The lens is sharper. The displacement of the focal planes due to LoCA is about the same, but the CoC of the blue plane when the lens is focused at the peak of the WB raw curve will be less because now we’re diving the shift by 2.8 instead of 2.
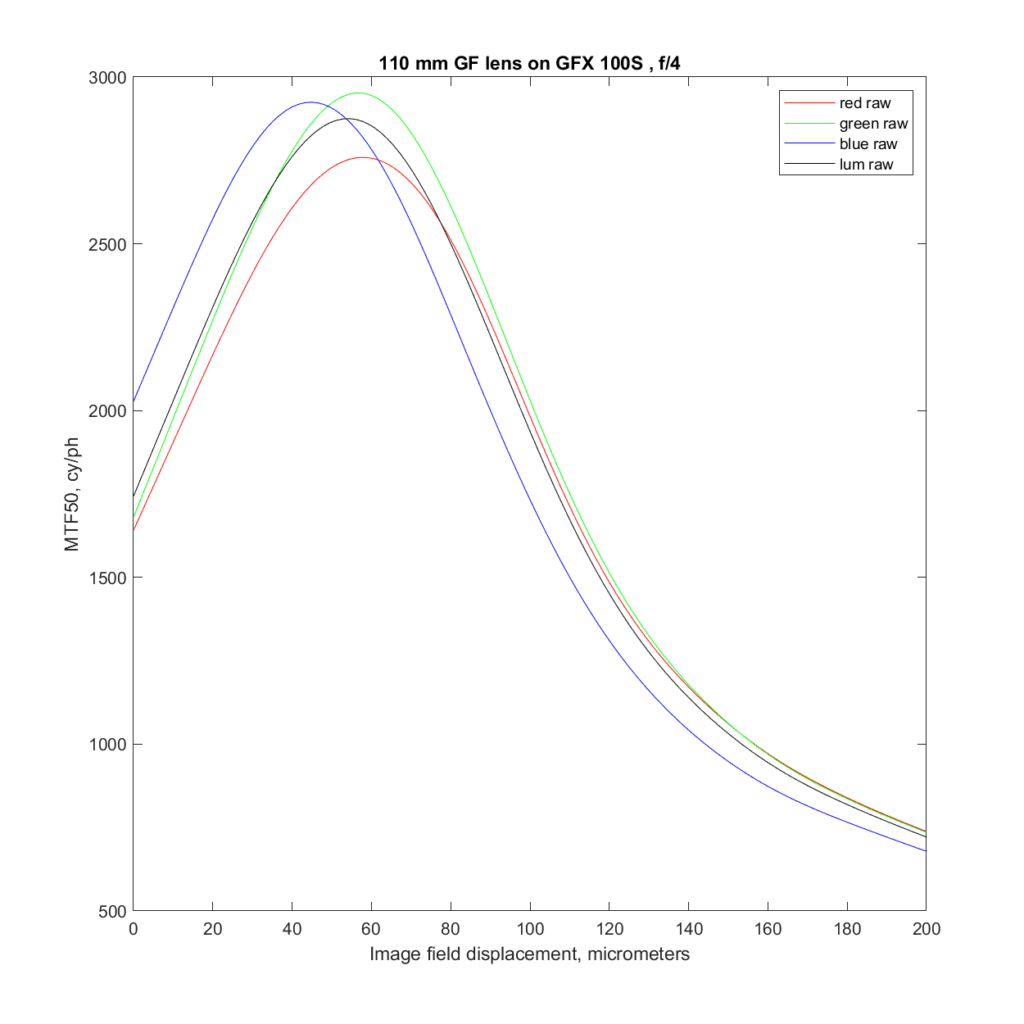
Next, f/4:
The lens is about as sharp at f/4 as at f/2.8, but you can already see the effects of diffraction. The red plane is the most affected, because diffraction is proportional to wavelength.
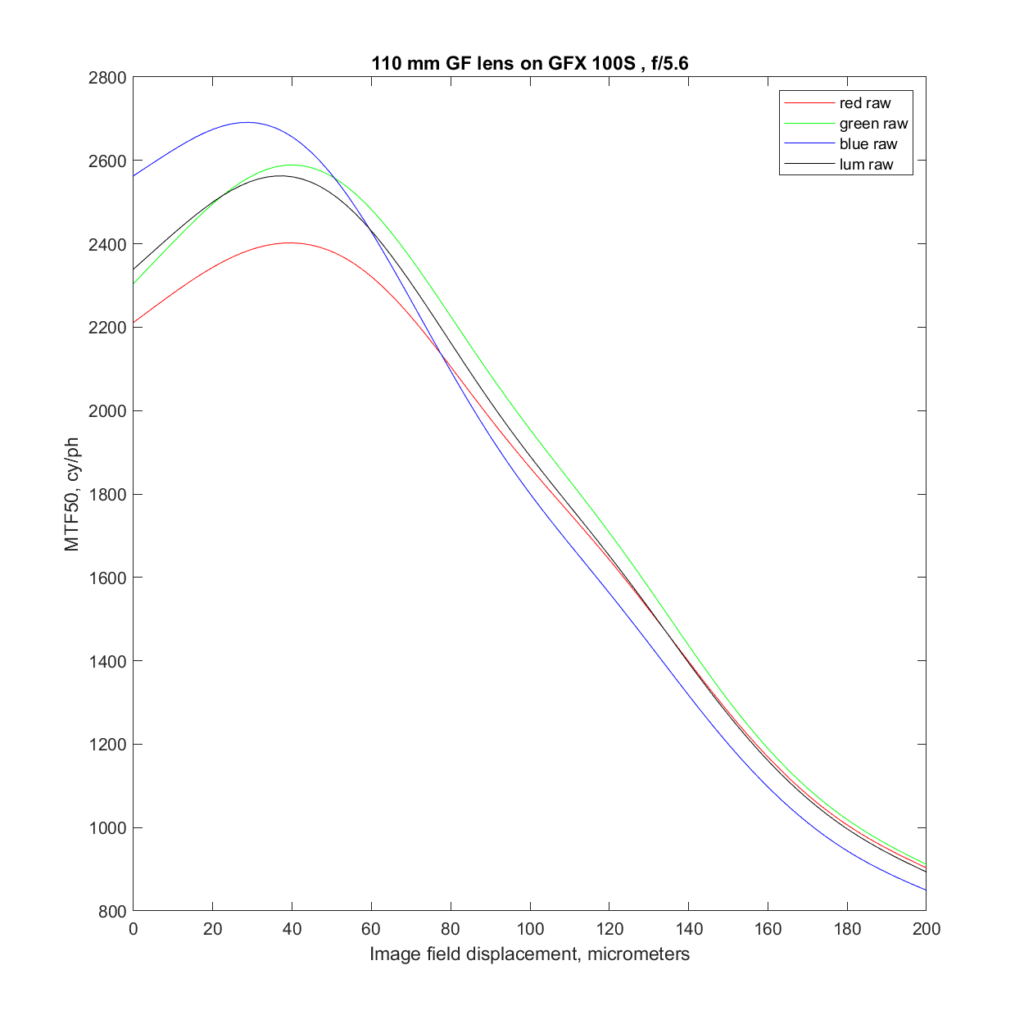
At f/5.6:
Now the green plane is significantly pushed down by diffraction, and the blue plane, which started out the least sharp, is now the sharpest.
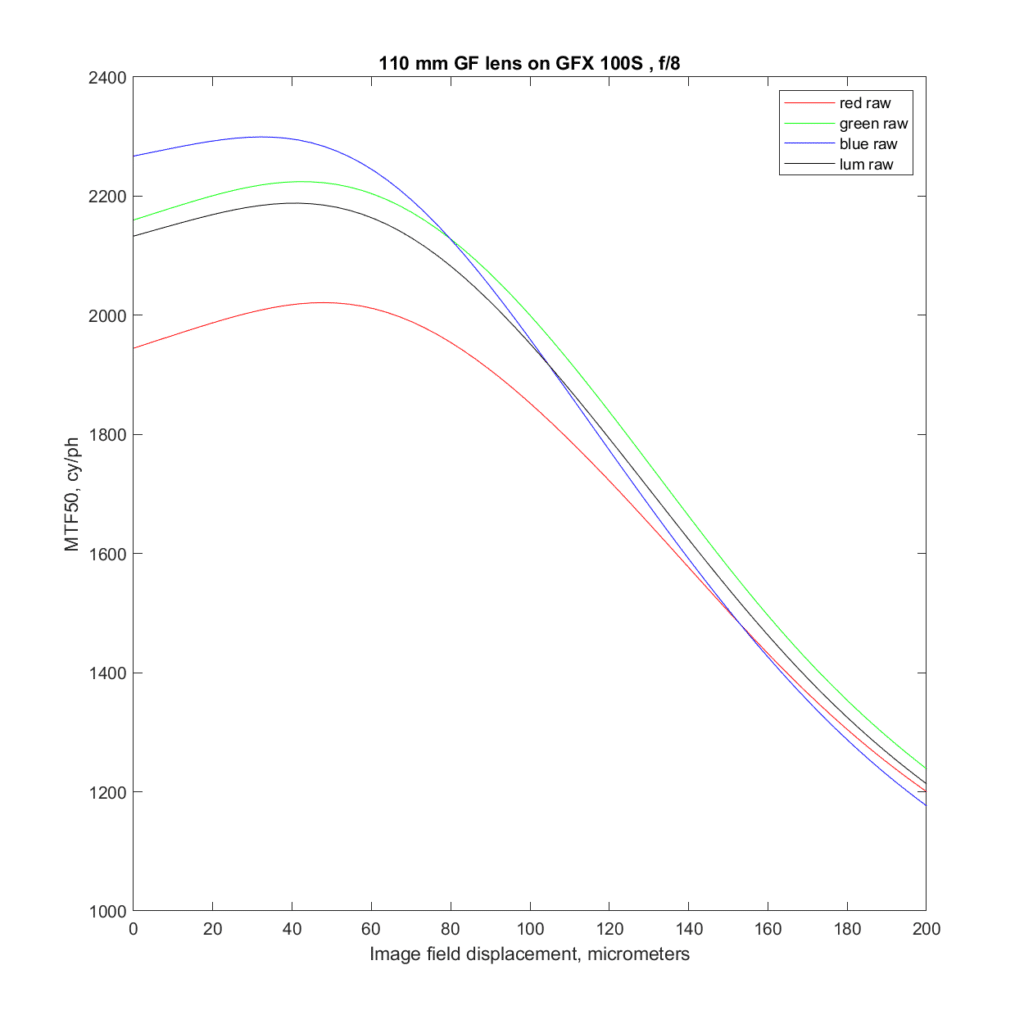
At f/8, diffraction is affecting all the planes, and LoCA is no longer an issue.
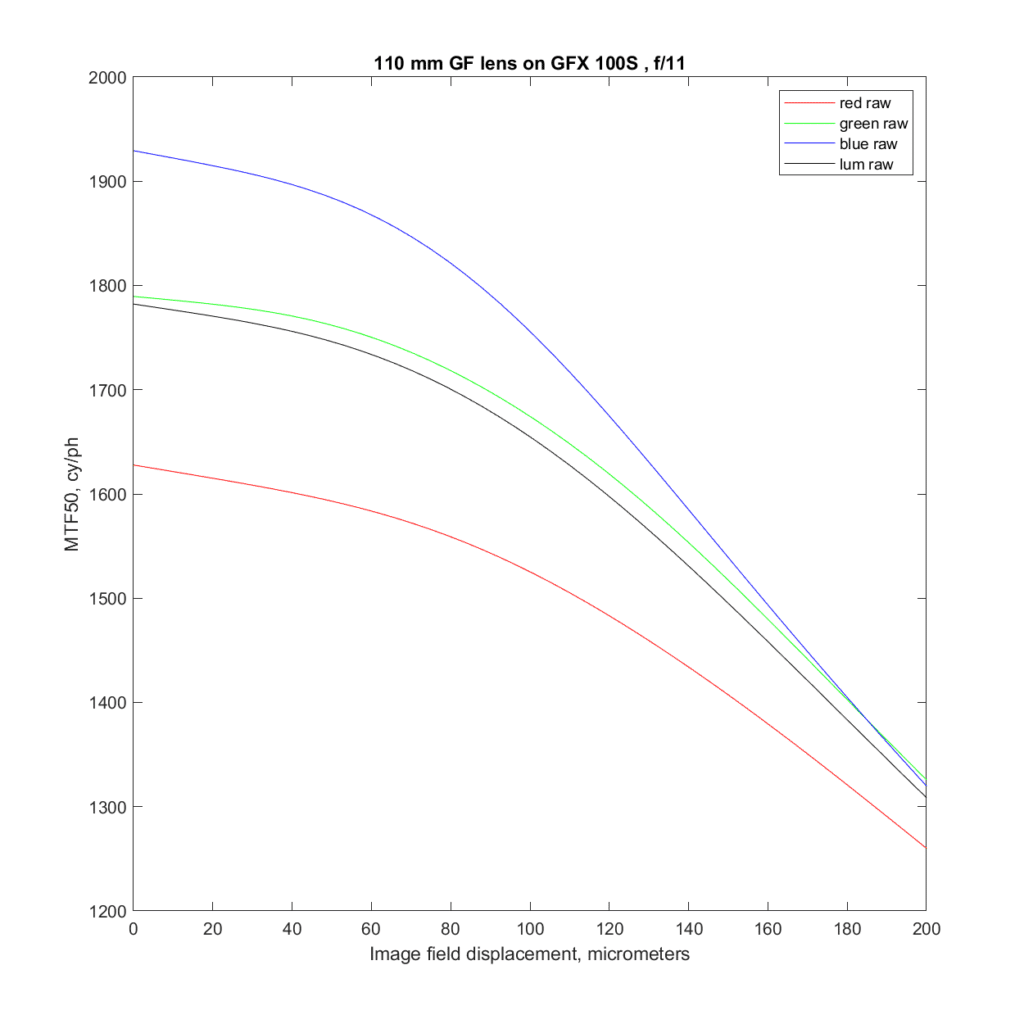
What was true at f/8 is true in spades at f/11.
Ilya Zakharevich says
Ⓐ Misprint: 20 mm (instead of 20 μm).
Ⓑ Did not you miss focus with ƒ/11? (This affects Ⓒ too.)
Ⓒ I think the way you plotted all-ƒ/NUMBERS-together can be made way less confusing. Would not aligning the tops make plots more clear (modulo the missing top for Ⓑ)?
JimK says
a) Misprint corrected. Thanks.
b) The camera was focused only once, at the beginning of the entire 480-shot series.
c) Aligning the tops would obscure the focus shift.
Ilya Zakharevich says
> c) Aligning the tops would obscure the focus shift.
This IS the whole point of my suggestion. I suspect that this “shift” does not reflect anything “real” which happens, and only reflects the random drift…
JimK says
Nope. It is repeatable. And it’s similar to what I measure with a razor blade and a Cognisys rail.
Brandon Dube says
Focal shift happens because spherical aberration is reduced by closing the aperture. As a consequence, the optimum focus offset changes, too.
If at F/2 you had 1 wave of spherical, 1r^4, then you would balance it with -1r^2 for a particular, good “best focus” criteria, and r=1.
That is, a r^4 – b r^2 =0
a=b=1, r=1.
At F/4 you have now have r=0.25, so the spherical term is 0.004 waves peak. To have the same focus criteria you want the r^2 Defocus term to be -0.004. b must now be ~8/125.
The change in b is focus shift.
Ilya Zakharevich says
How come?! For me, it is hard to imagine the mechanics of having huge focus drift with manual focus, and reproducible starting point with series of focus shifts!
Do you have any idea?
(BTW, was forgetting: a lot of thanks for these measurements!)
JimK says
Like Brandon said: spherical aberration.
JimK says
The focus drift with manual focusing is small compared to the focus shift due to SA.
Ilya Zakharevich says
This is not what I would call “small”: it is ∼8 μm drift vs. your “measured shifts” of ∼15 μm.
Indeed, the drift you reported results in MTF50 changing from 2850 to 2500, @ƒ/2.8. By your last graph above, it is about 8 μm.
Do you think that this is “small enough”?
JimK says
I’ve gone back and done some experimentation, and I’m afraid that you are right: the stability of the return to start portion of the focus bracketing feature is not sufficient to so the focus shift tests that I was doing. The fact that they looked like my rail results gave me false confidence. I will publish my focus bracketing test results and rewrite the two offending posts.
I have another way to measure focus shift, but it doesn’t work at these subject distances.
Thank you.