This is one in a series of posts on the Fujifilm GFX 100S. You should be able to find all the posts about that camera in the Category List on the right sidebar, below the Articles widget. There’s a drop-down menu there that you can use to get to all the posts in this series; just look for “GFX 100S”. Since it’s more about the lenses than the camera, I’m also tagging it with the other Fuji GFX tags.
The last post was about the 80 mm f/1.7 GF lens. For this one, I’ll do the same with the 110 mm f/2 GF.
There are two important aspects to bokeh. It seems most people, when they hear the word, think immediately of the look of parts of the scene that are for out of focus. That’s a good thing to think about when buying, selecting, or using a lens, but the, ahem, focus, of today’s post is going to be on another aspect of bokeh: the characteristics of the lens in reddering subjects that are nearly in focus. The way the lens handles the change from sharply in focus to definitely out of focus is important in the look that the camera and lens give to three-dimensional subjects closer than landscape distances.
The MTF Mapper returns information about the line spread function (LSF), which can be thought of as the radial component of the point spread function (PSF).* The PSF defines the image-forming behavior of the lens. Looking at the PSF yields the same information as looking at the modulation transfer function; the difference is that the PSF is in the space domain, and the MTF is in the frequency domain (thanks to Joseph Fourier, 1768-1830). Sometimes the frequency domain is the way to look at things. Other times, you’re better off staying in the space domain. Trying to assess the rendering qualities of a lens in the space domain seems to work better. For one, it’s pretty easy to do it in a way that allows you to visualize the color effects. For another, do to looking at out of focus distant spectral highlights, we are more or less used to looking at PSFs.
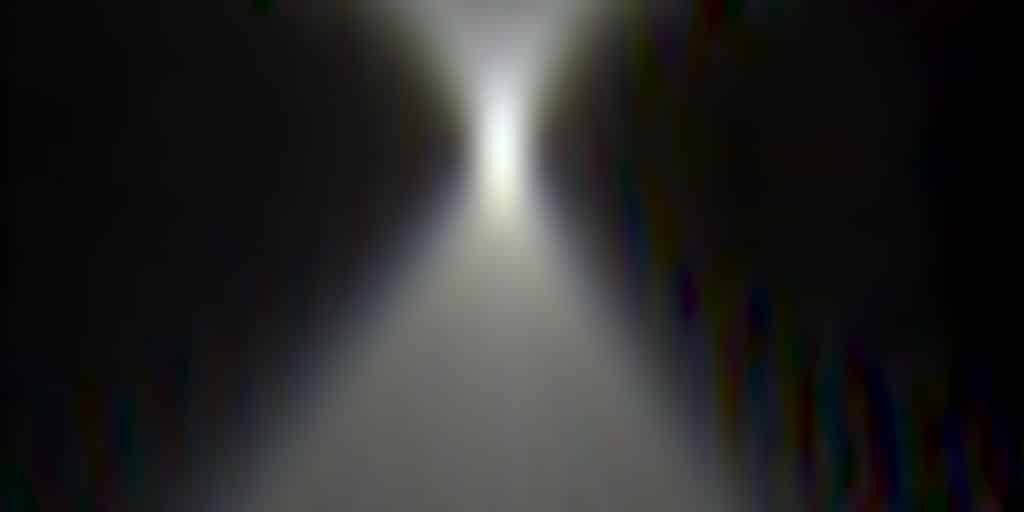
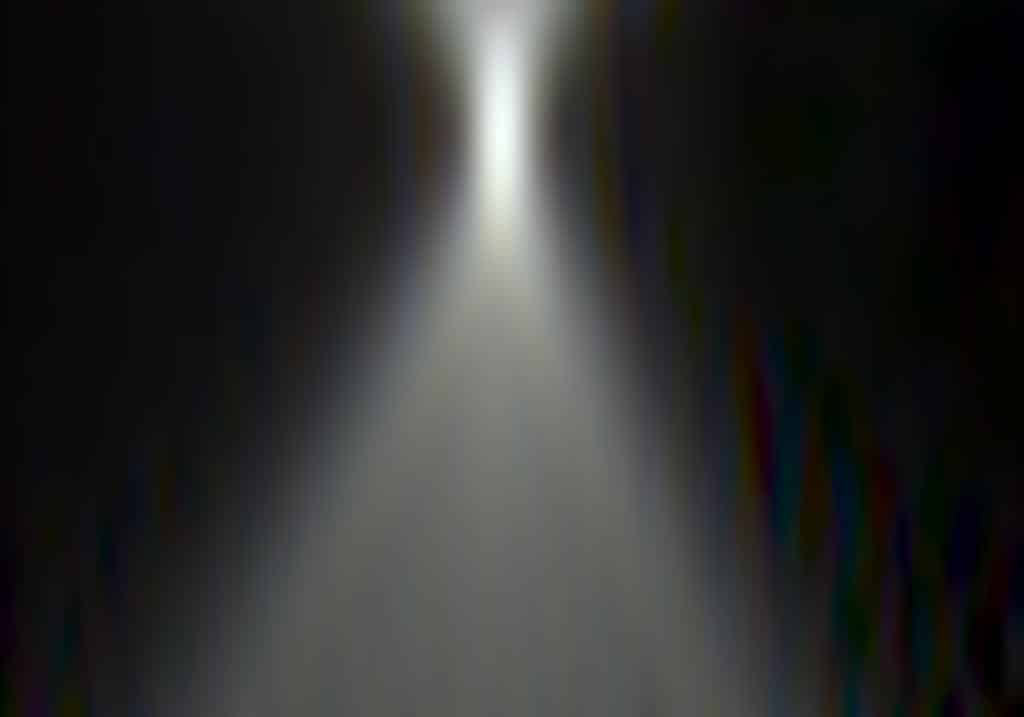
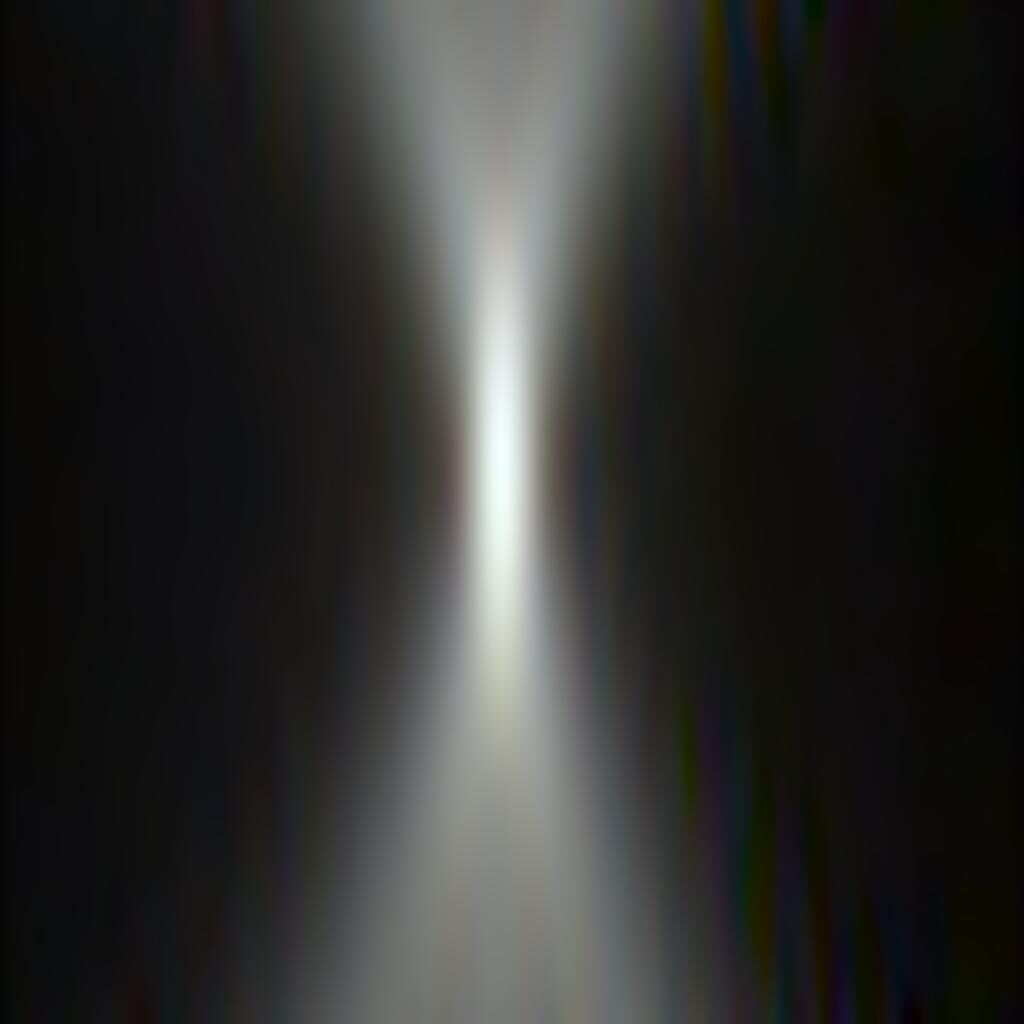
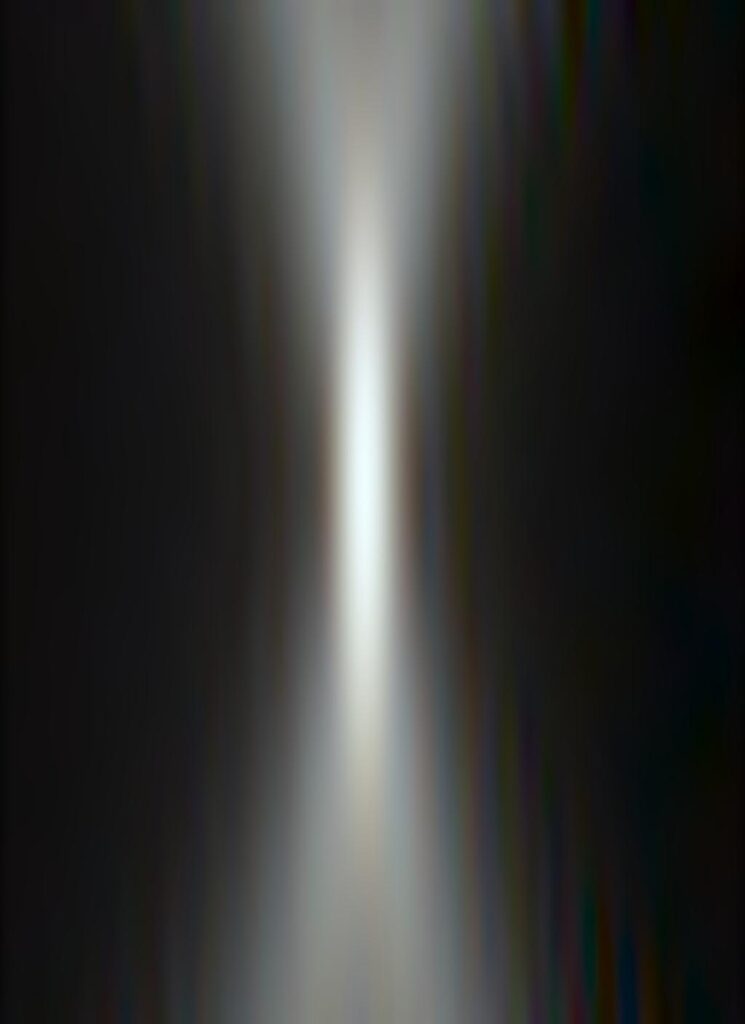
The above image is with the 110/2 wide open. The vertical direction is the shift of the focal plane with respect to the plane of the sensor. Focus distance runs from top to bottom, with front-focused at the top and back-focused at the bottom. The horizontal axis a heavily-magnified view of distance in the sensor plane. The colors are highly approximate; I just assigned the raw channels to their respective sRGB channels. There is far less longitudinal chromatic aberration (LoCA) than with the 80/1.7.
F/2.8:
F/4:
F/5.6:
F/8:
F/11:
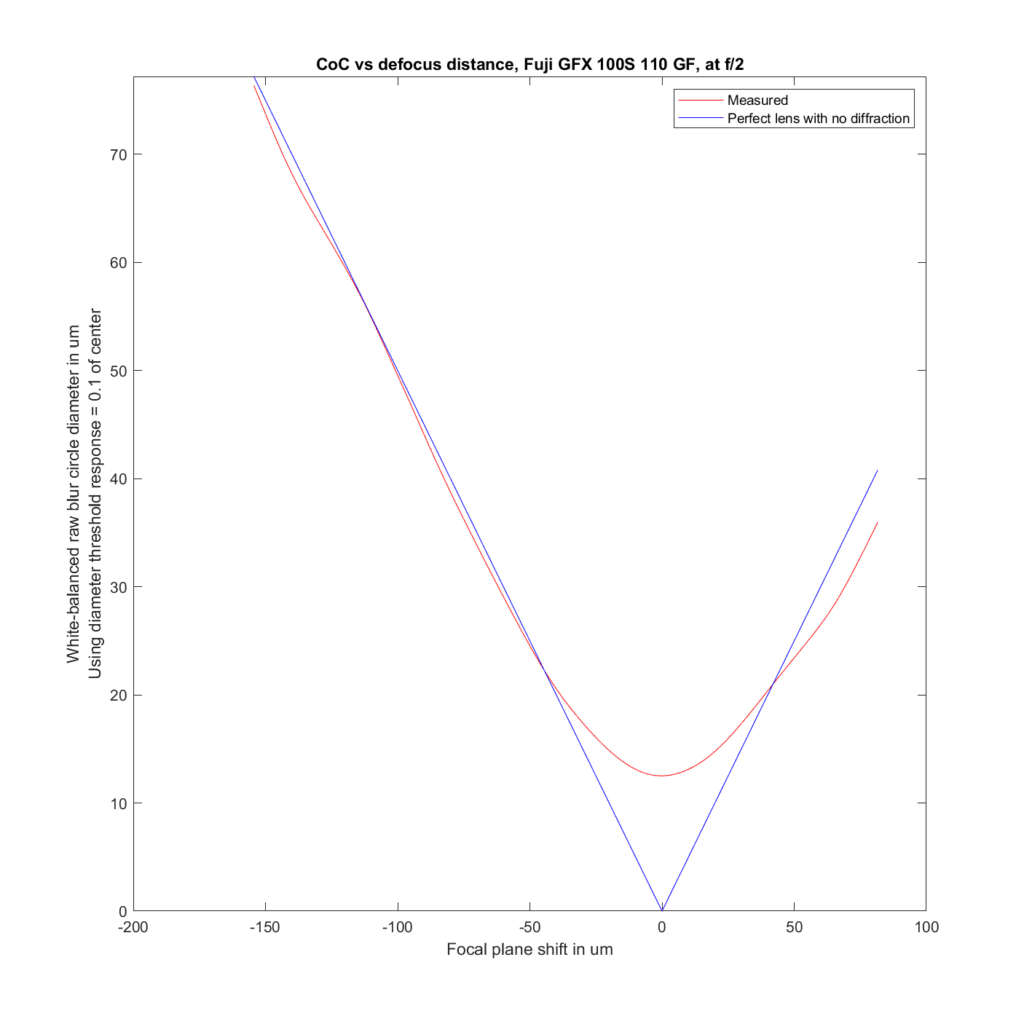
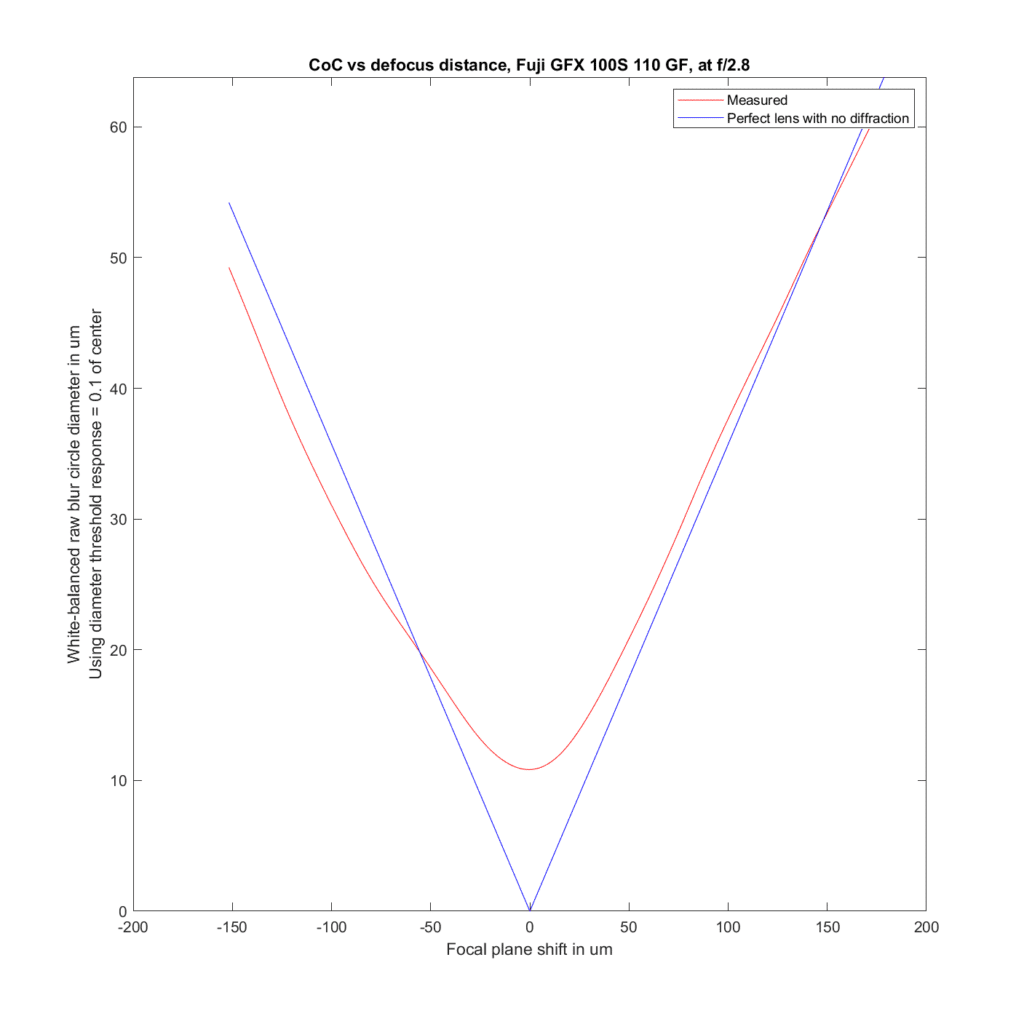
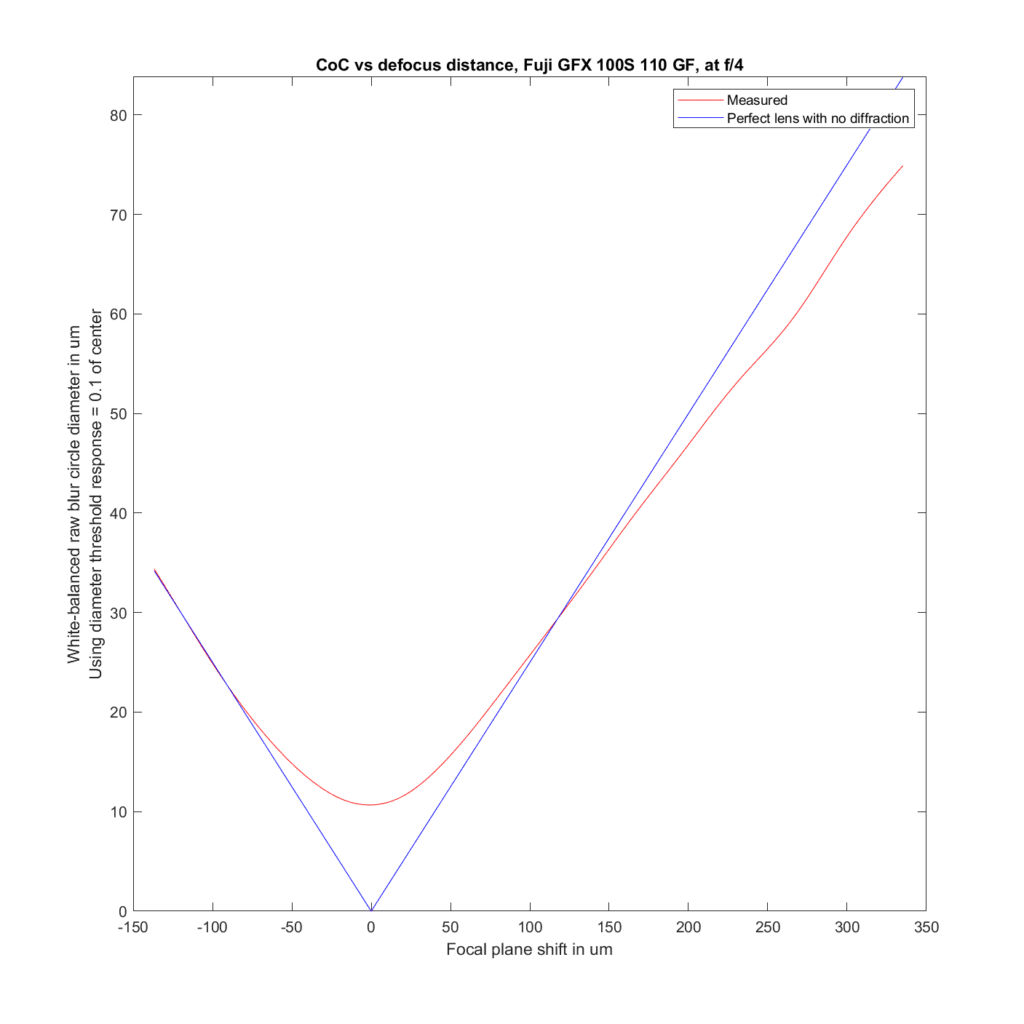
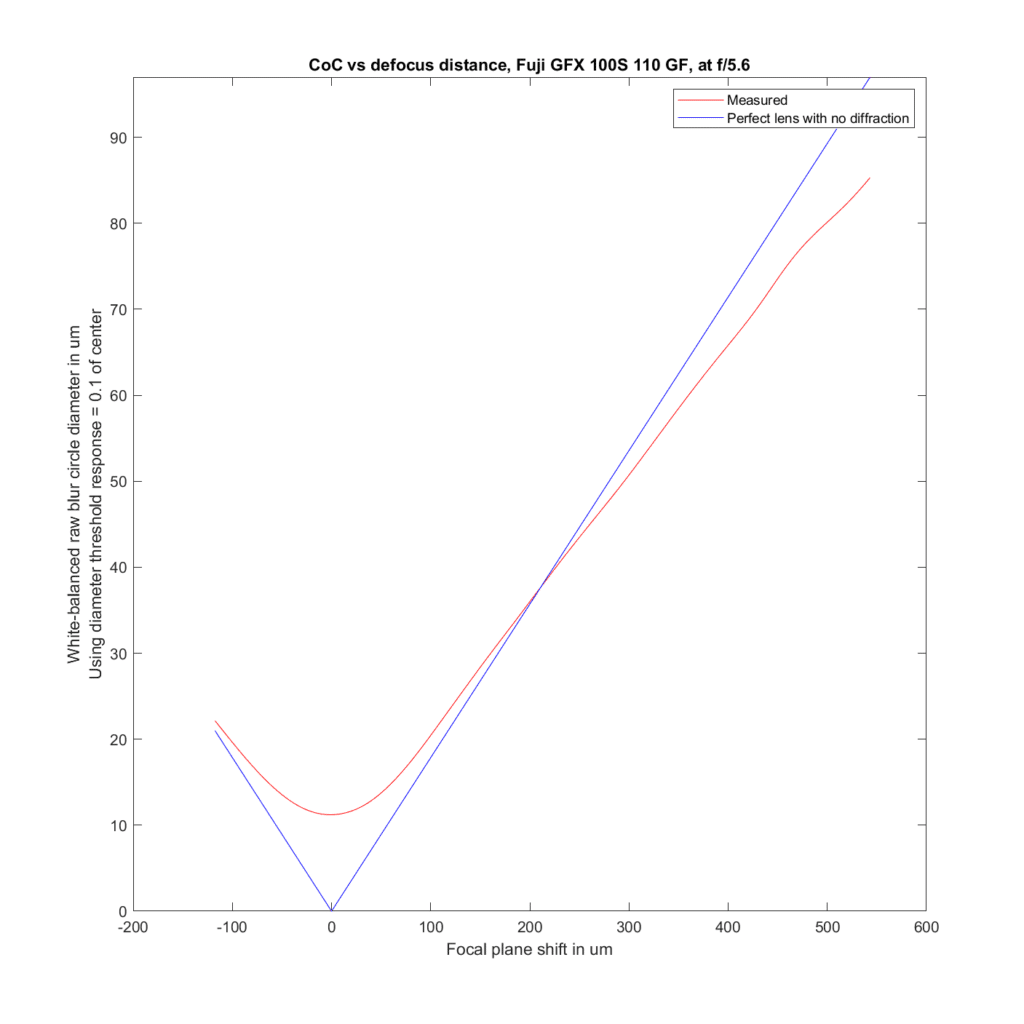
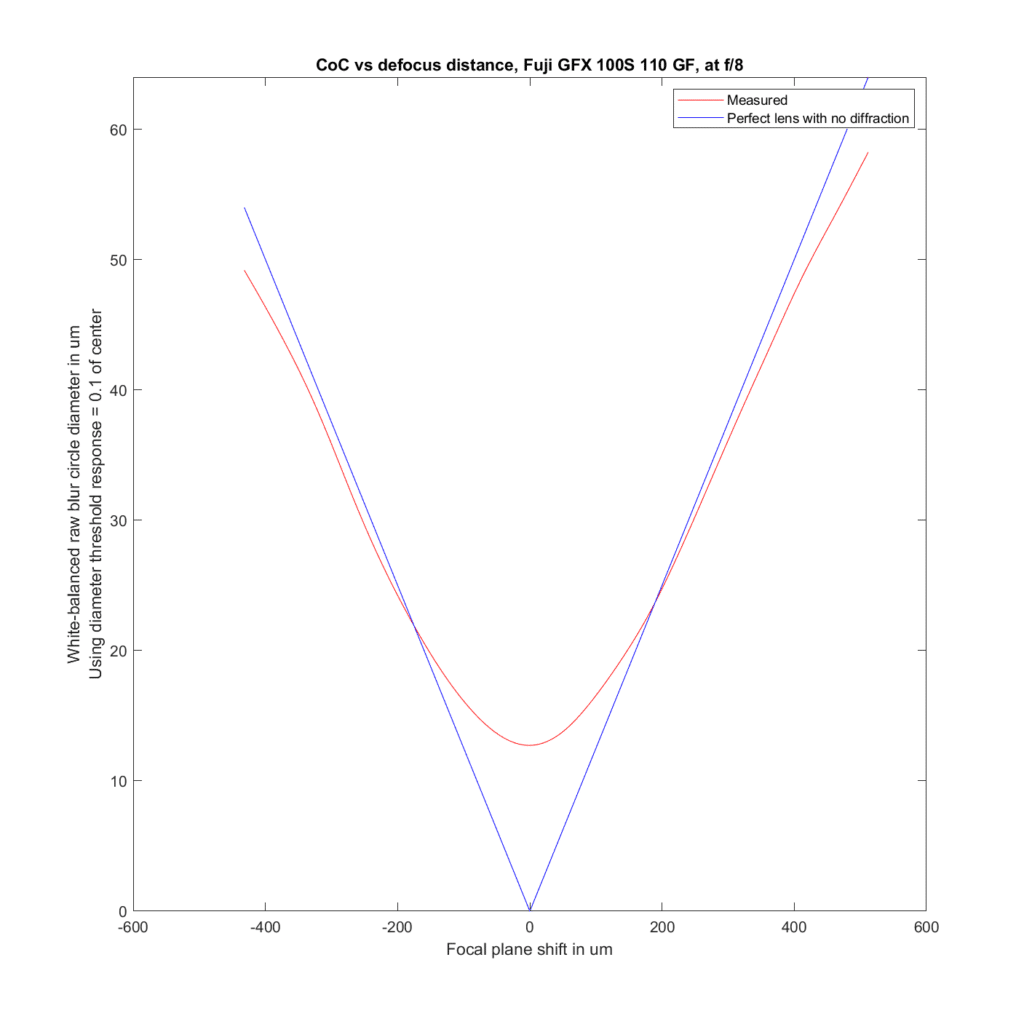
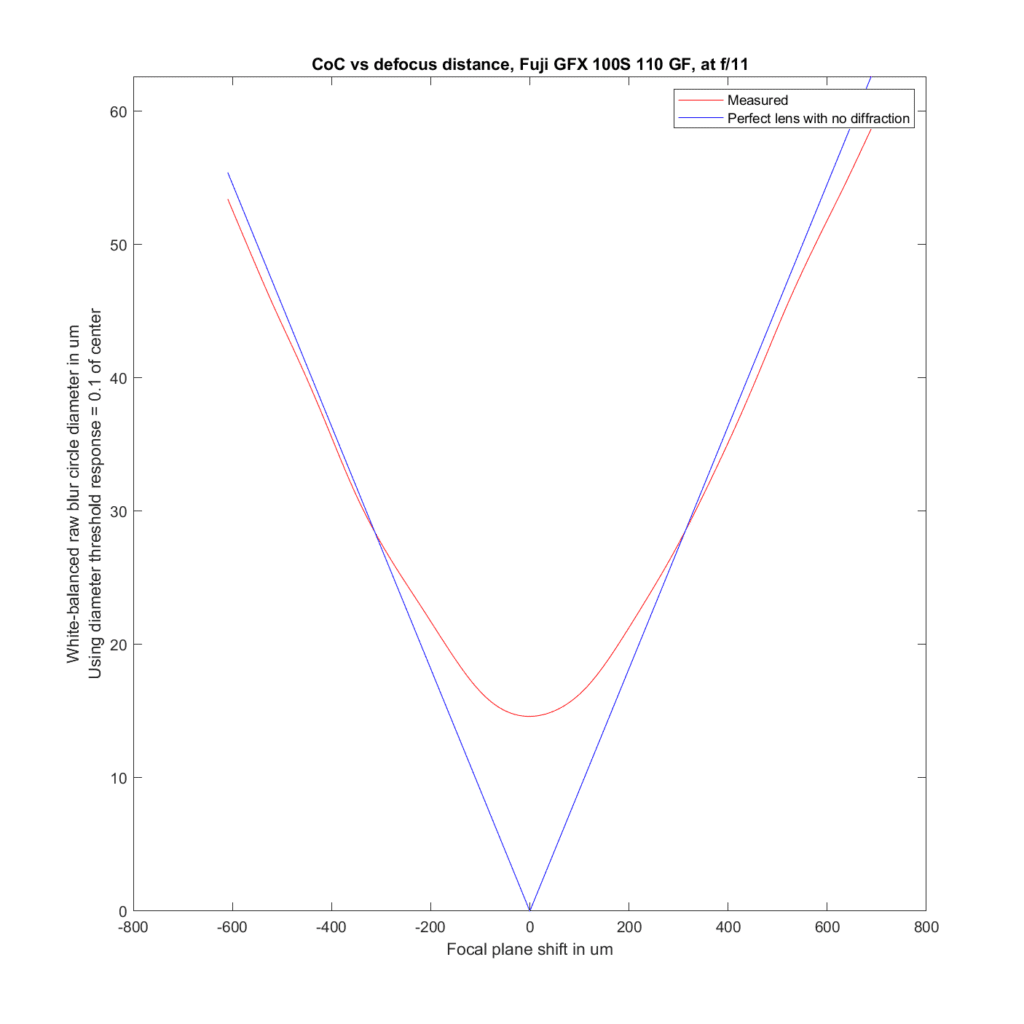
We can analyze the transfocal behavior of the lens by comparing it to an ideal lens with no diffraction. For the plots to follow, I’ve used the white-balanced raw channels as computer fodder, and used a threshold to define blur circle size that is fairly pessimistic. I take the intensity at the center of the blur circle, and define the radius of the blur circle as the distance between the center and that point where the intensity drops to one tenth of the value at the center. The blur circle data plotted above that MTF Mapper covers both sides of the line spread function or PSF, and I’m computing the radius of the blur circle both ways, averaging those two numbers, and doubling it to get the diameter of the blur circle. That gives me the red curves in the plots below. The blue curves are what geometric optics says should be the case for an ideal lens with no diffraction.
Front-focusing is on the left. Back-focusing is on the right. The CoC or blur circle diameter is the vertical axis. In a perfect lens, the blur circle diameter goes to zero at the point of focus. In this lens, it barely gets below 15 micrometers (um) in diameter. There are several reasons for that, the ones that I think are the most important are the small lens aberrations, combined with the pessimistic formulation for the blur circle metric for the measured case. Agreement with the ideal case is pretty good.
F/2.8:
F/4:
F/5.6:
Away from the focal plane, agreement with geometrical optics is good.
*Jack Hogan points out that this is only approximately true. It’s an important point, since the rest of the post assumes that it is indeed true. Here’s what Jack has to say:
Radial component sounds like radial slice, though the two are not the same, as I am sure you know. For instance a slice of an Airy PSF touches zero at 1.22lambdaN, while the LSF never touches zero (though it hovers close to it there). The LSF is a projection of the full 2D PSF onto 1D. If we had a semi-opaque glass solid representing the PSF in front of us, the LSF would be about what we would see when looking at it from the side with one eye closed. Every bit of the 2D PSF contributes to the relative LSF.
Mathematically it is one instance of the Radon Transform of the PSF in the direction of the projection. Because of the Fourier Slice Theorem it turns out that such an LSF is equal to a radial slice (this time correctly) of the 2D MTF of the 2D PSF – in the direction perpendicular to the projection.
If we collected LSFs (or Edges) at varying angles we could use the inverse Radon Transform to reconstitute any full 2D PSF, even non radially symmetric ones like coma etc.. That’s how CAT scans and MRIs work.


Brandon Dube says
Hi Jim,
There’s more information in the PSF (or LSF) than the MTF. The MTF is the modulus of the Fourier transform, but lots of PSFs (or LSFs) have lots of structure in their Fourier phase that is lost in the MTF. Loosely, any odd order aberration will contribute to the PTF (phase transfer function).
JimK says
I see your point. I’m not looking at any phase information in the PSF, but that doesn’t keep there from being phase information lost in taking the absolute value in the frequency domain.