• site home
  • blog home
  • galleries
  • contact
  • underwater
  • the bleeding edge

the last word

Photography meets digital computer technology. Photography wins -- most of the time.

You are here: Home / Leica Q2 Monochrom / Leica Q2 Monochrom dark-field ISO spectra

Leica Q2 Monochrom dark-field ISO spectra

May 18, 2022 JimK Leave a Comment

This is the seventh post in a series about the Leica Q2 Monochrom. You can see all the other posts in the series by looking in the Category List drop-down menu on the right side of the page.

In a previous post, I show you some anomalies in the Leica Q2 Monochrom dark-field histograms. Such things are sometime indicative of raw data manipulation that can be observed in the spatial domain. Wanting to take a look, I modified my sensor spectral analysis program to work with monochromaic files, and looked at the dark-field ISO series.

ISO 100


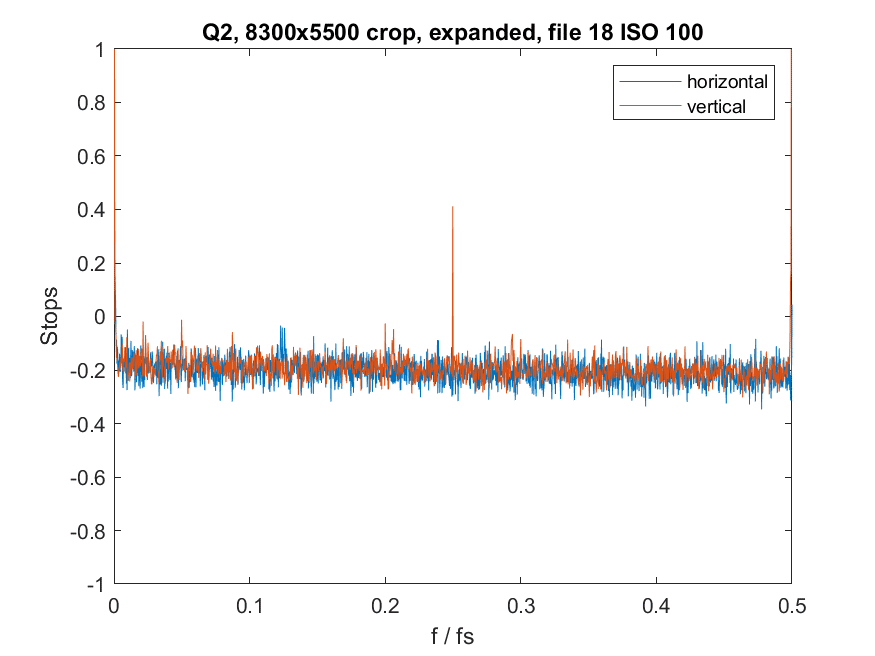
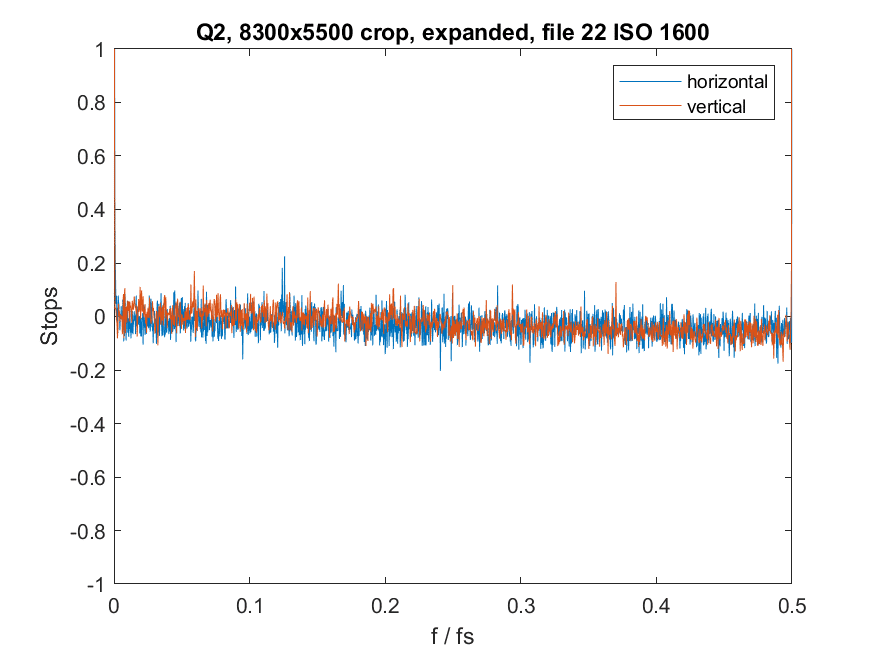
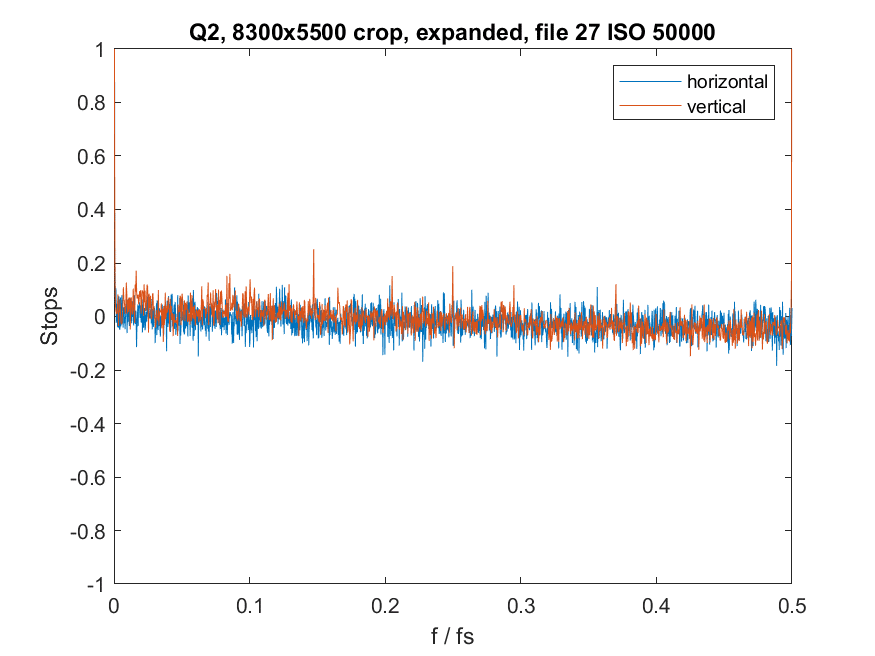
The data is from a crop of the full image. The crop dimensions are 8300 by 5500 pixels. Analyzing the whole frame produces strange results that I’ll talk about at the end of this post. The horizontal axis is frequency normalized to the sampling frequency of the sensor. 0.5 is the Nyquist frequency. The noise is expected; after all, we’re analyzing the spectrum of noise. The spike at one-quarter of the sampling frequency in the vertical direction is an indication of some systematic errors, but it is small enough to not be something to worry about. This is good performance.

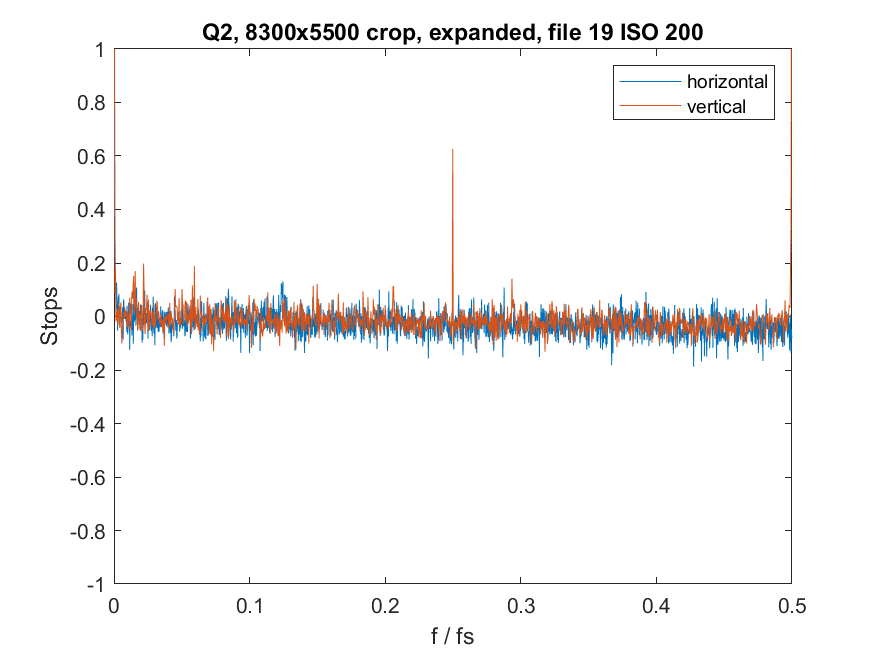
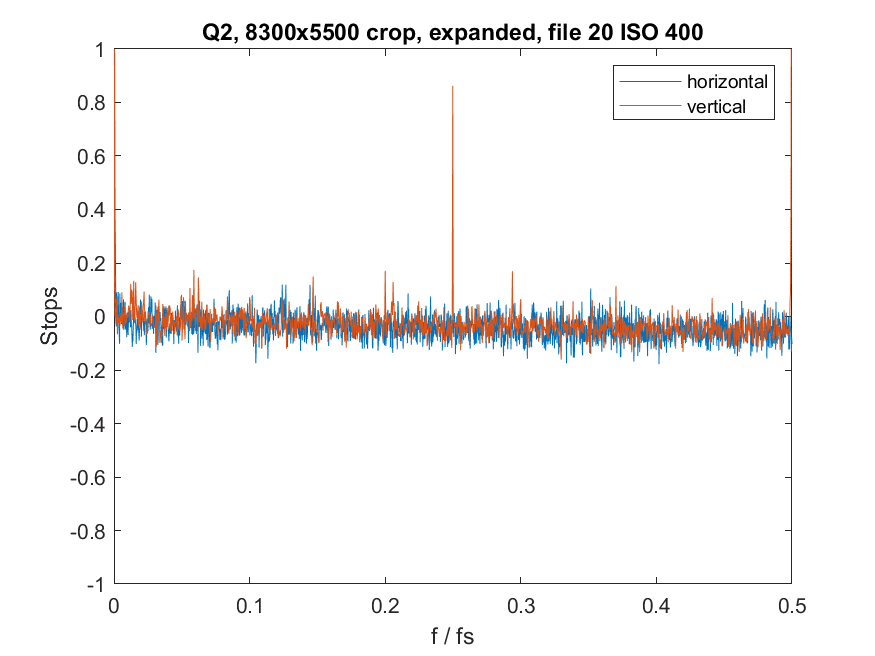
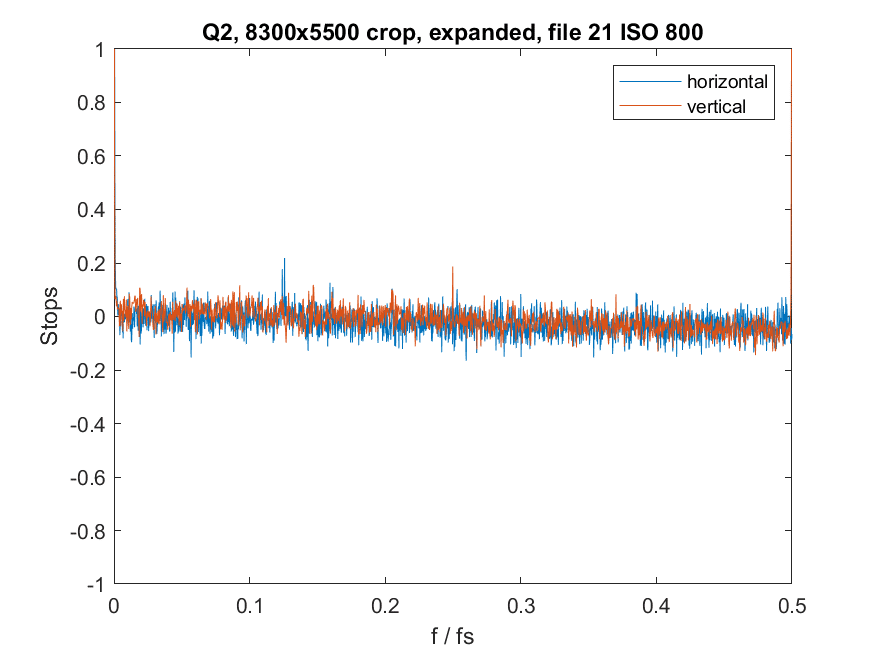
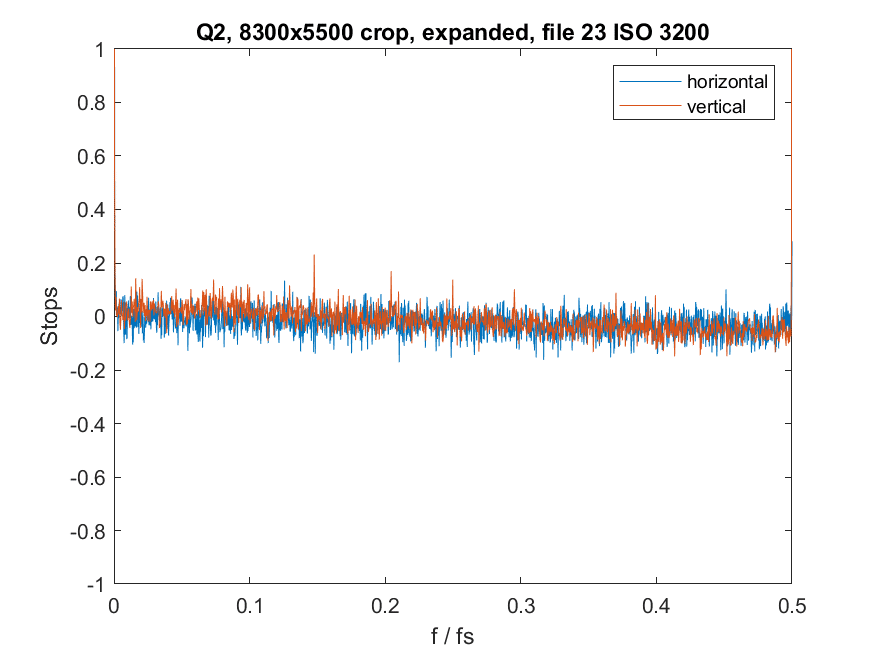
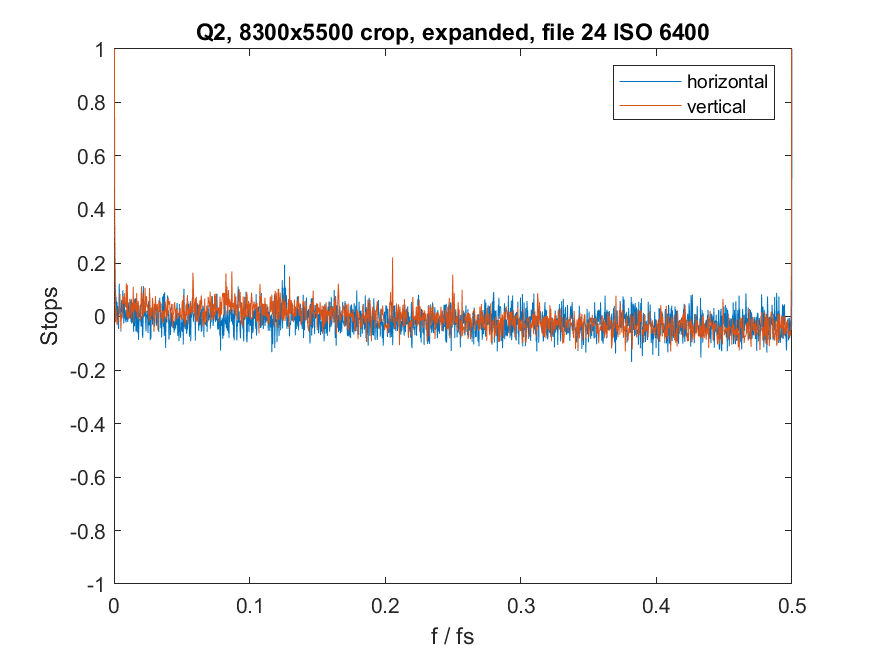
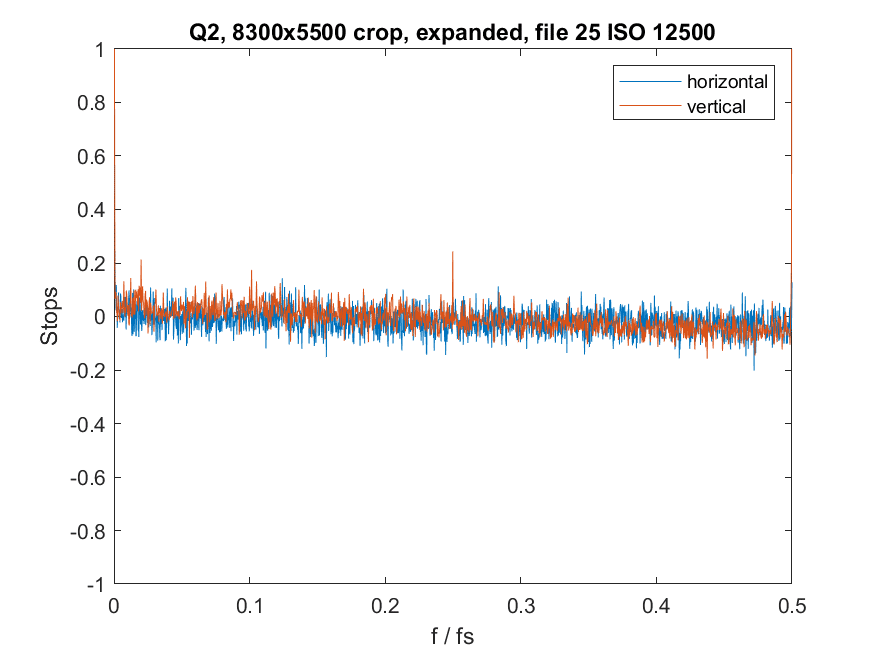
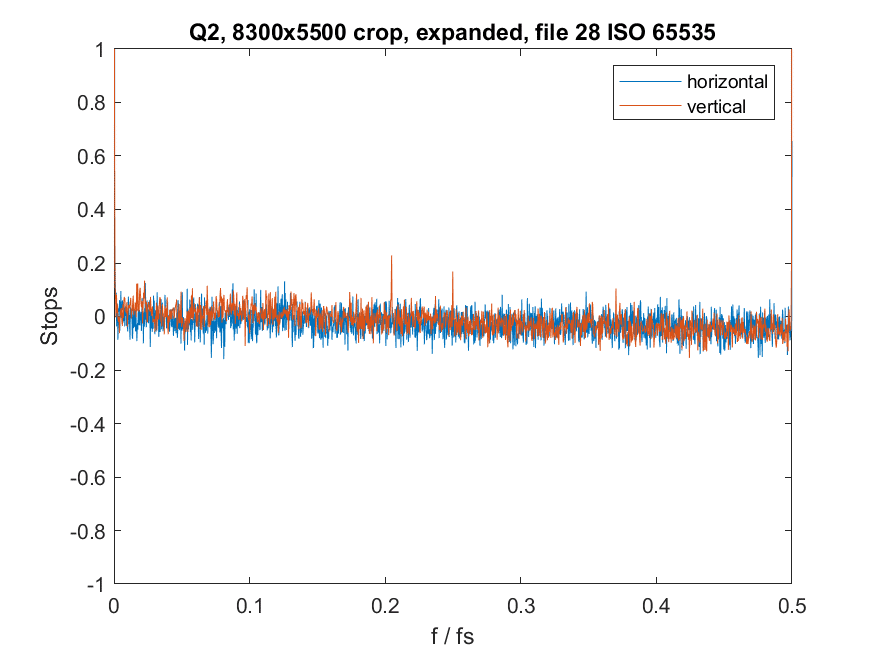
The rest of the ISOs look similar, with the spike at 1/4 the sampling frequency getting smaller as the read noise swamps it out.

ISO 200


ISO 400


ISO 800


ISO 1600


ISO 3200


ISO 6400


iso 12500


ISO 25000


ISO 50000


ISO 100,000 (ISO data in caption is wrong because the Q2 Monochrom writes the wrong data into the EXIF field

Here’s a sample with no crop:

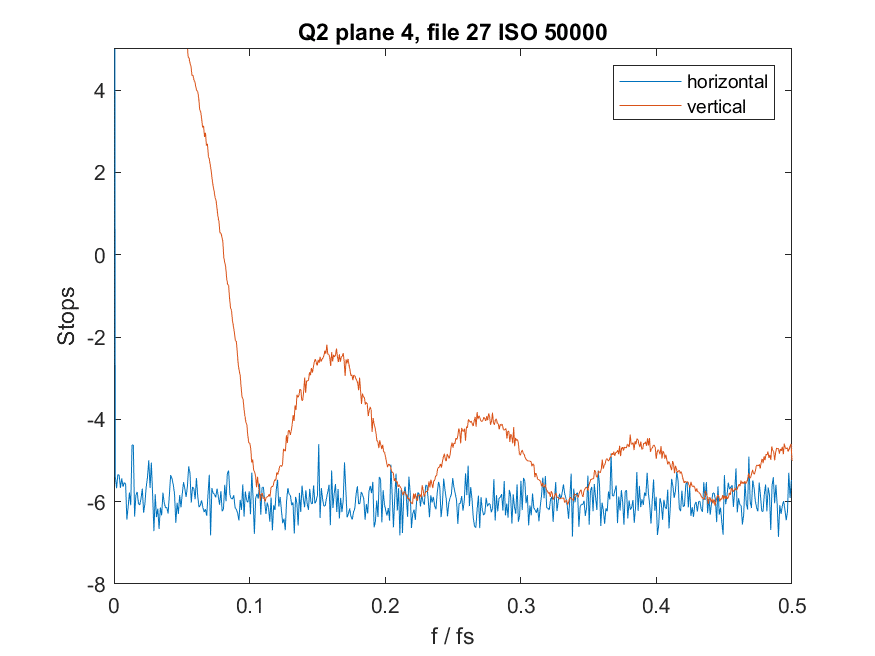
There’s something going on that is causing the periodicity in the vertical direction. I’ll be looking into that. If may be information that is written into the file by the camera, but that is not part of the intended image area.

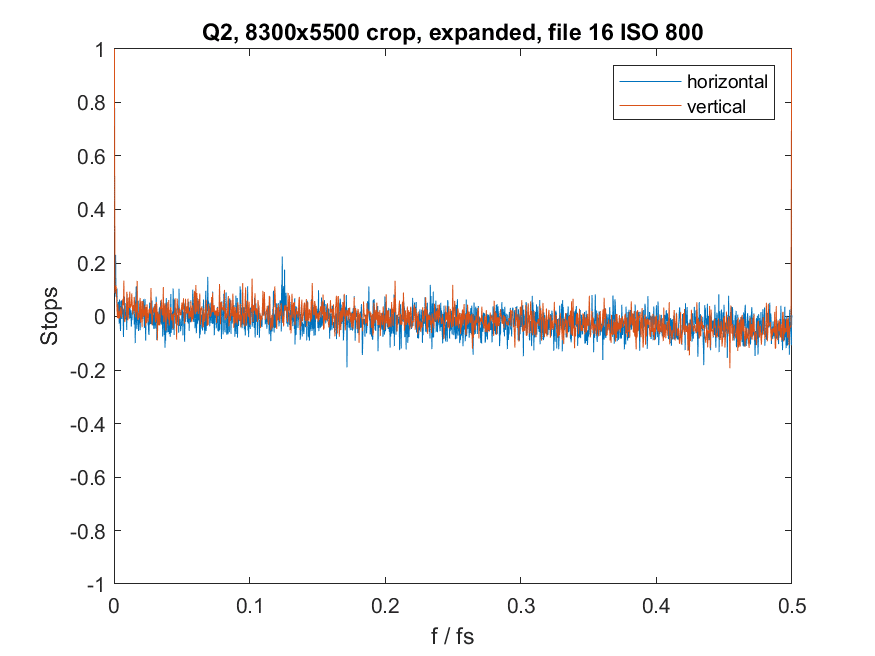
I set the ISO to 800 and looked at the dark-field spectra with shutter speeds from 1/2000 through 1 second. They all looked fine. Here’s a sample at 1 second:


Leica Q2 Monochrom

← Leica Q2 Monochrom dark-field ISO histograms Uncurling the Leica Q2 Monochrom strap →

Leave a Reply Cancel reply

Your email address will not be published. Required fields are marked *

May 2025
S M T W T F S
 123
45678910
11121314151617
18192021222324
25262728293031
« Apr    

Articles

  • About
    • Patents and papers about color
    • Who am I?
  • How to…
    • Backing up photographic images
    • How to change email providers
    • How to shoot slanted edge images for me
  • Lens screening testing
    • Equipment and Software
    • Examples
      • Bad and OK 200-600 at 600
      • Excellent 180-400 zoom
      • Fair 14-30mm zoom
      • Good 100-200 mm MF zoom
      • Good 100-400 zoom
      • Good 100mm lens on P1 P45+
      • Good 120mm MF lens
      • Good 18mm FF lens
      • Good 24-105 mm FF lens
      • Good 24-70 FF zoom
      • Good 35 mm FF lens
      • Good 35-70 MF lens
      • Good 60 mm lens on IQ3-100
      • Good 63 mm MF lens
      • Good 65 mm FF lens
      • Good 85 mm FF lens
      • Good and bad 25mm FF lenses
      • Good zoom at 24 mm
      • Marginal 18mm lens
      • Marginal 35mm FF lens
      • Mildly problematic 55 mm FF lens
      • OK 16-35mm zoom
      • OK 60mm lens on P1 P45+
      • OK Sony 600mm f/4
      • Pretty good 16-35 FF zoom
      • Pretty good 90mm FF lens
      • Problematic 400 mm FF lens
      • Tilted 20 mm f/1.8 FF lens
      • Tilted 30 mm MF lens
      • Tilted 50 mm FF lens
      • Two 15mm FF lenses
    • Found a problem – now what?
    • Goals for this test
    • Minimum target distances
      • MFT
      • APS-C
      • Full frame
      • Small medium format
    • Printable Siemens Star targets
    • Target size on sensor
      • MFT
      • APS-C
      • Full frame
      • Small medium format
    • Test instructions — postproduction
    • Test instructions — reading the images
    • Test instructions – capture
    • Theory of the test
    • What’s wrong with conventional lens screening?
  • Previsualization heresy
  • Privacy Policy
  • Recommended photographic web sites
  • Using in-camera histograms for ETTR
    • Acknowledgments
    • Why ETTR?
    • Normal in-camera histograms
    • Image processing for in-camera histograms
    • Making the in-camera histogram closely represent the raw histogram
    • Shortcuts to UniWB
    • Preparing for monitor-based UniWB
    • A one-step UniWB procedure
    • The math behind the one-step method
    • Iteration using Newton’s Method

Category List

Recent Comments

  • JimK on How Sensor Noise Scales with Exposure Time
  • Štěpán Kaňa on Calculating reach for wildlife photography
  • Štěpán Kaňa on How Sensor Noise Scales with Exposure Time
  • JimK on Calculating reach for wildlife photography
  • Geofrey on Calculating reach for wildlife photography
  • JimK on Calculating reach for wildlife photography
  • Geofrey on Calculating reach for wildlife photography
  • Javier Sanchez on The 16-Bit Fallacy: Why More Isn’t Always Better in Medium Format Cameras
  • Mike MacDonald on Your photograph looks like a painting?
  • Mike MacDonald on Your photograph looks like a painting?

Archives

Copyright © 2025 · Daily Dish Pro On Genesis Framework · WordPress · Log in

Unless otherwise noted, all images copyright Jim Kasson.