This is one in a series of posts on the Nikon Z7. You should be able to find all the posts about that camera in the Category List on the right sidebar, below the Articles widget. There’s a drop-down menu there that you can use to get to all the posts in this series; just look for “Nikon Z6/7”.
In the previous post, I reported on focus shift, and autofocus accuracy for the Nikon Z7 with the 24-70 mm f/4 Nikkor S at 35 mm focal length. Now I’ll do the same with the lens set at 70 mm. I increased the target distance to 1.8 meters. Take a look at yesterday’s post for some context on the test.
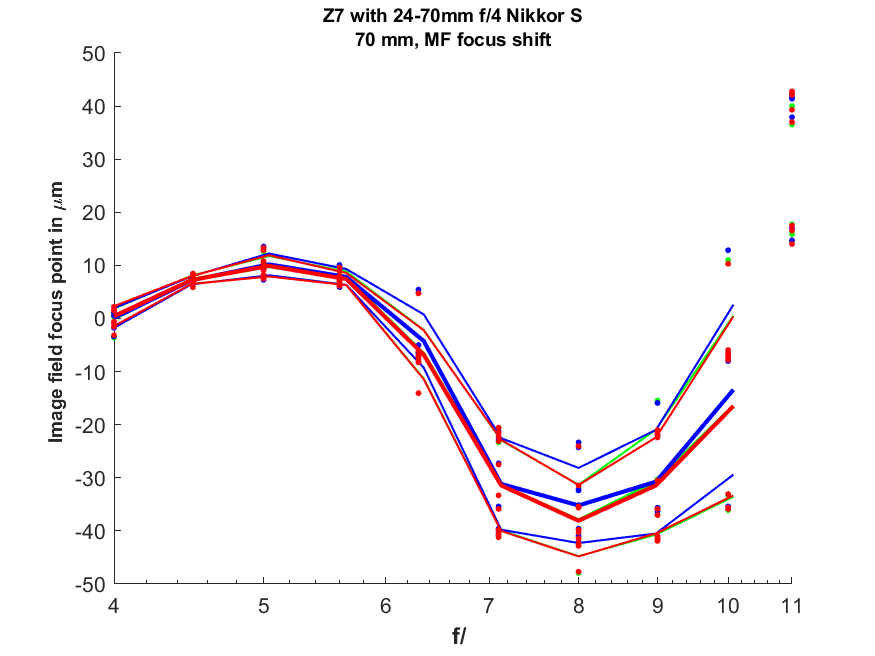
I mounted the 24-70 mm f/4 Nikkor S on the Z7 and set the focal length to 70 mm. I set up 1 meter from the target and measured the focus shift of the lens as I stopped it down from f/4 to f/11 in 1/3 stop steps.
The focus shift is S-shaped, which is something I don’t see often.
There are 10 measurements per tested aperture. They are plotted as dots. I measure the focus location in each of the Adobe RGB color planes, and which plane the measurement came from is indicated by the color of the dots. I’ve plotted the mean, mean-plus-standard-deviation, and mean-minus-standard-deviation values as lines. The amount of scattering in the dots and the distance between the mean-plus-standard-deviation and mean-minus-standard-deviation gives you an idea of the experimental error. The vertical axis is focus error at the image sensor in micrometers, with positive numbers indicating back-focus.
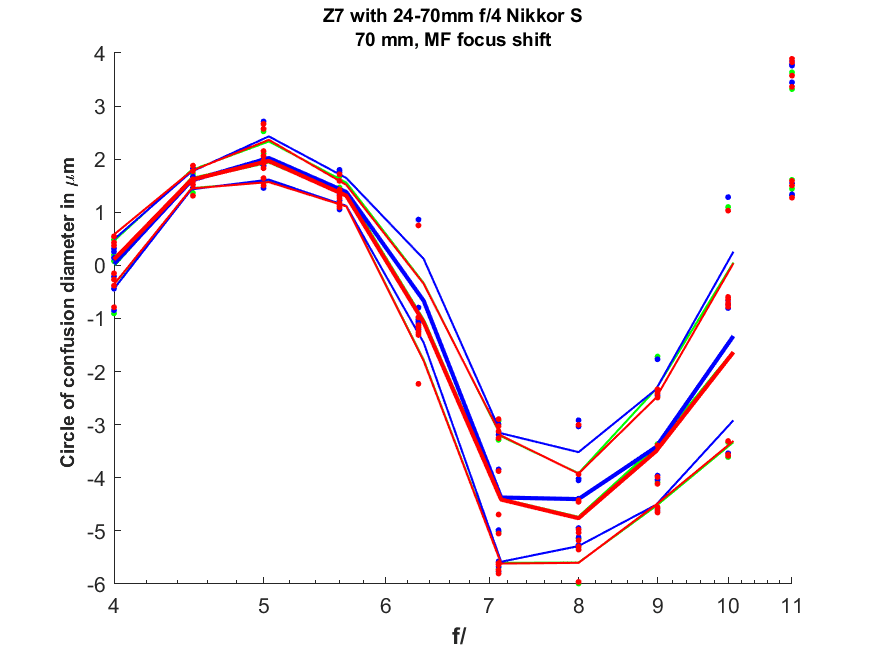
To get a better idea of how this will influence photography, consider the circles-of-confusion (CoCs) on the sensor implied by that much focus error:
The sensor pitch on the Z7 is about 4 and a half micrometers (um), and the worst error is a bit over that. This is low focus shift. Note also the fact that all three color planes are brought into focus at essentially the same plane. That means the lens has very low longitudinal chromatic aberration (LoCA). For a relatively inexpensive zoom lens, this is a spectacular performance. A word about the negative numbers on the CoC graph: of course, the circle of confusion can’t ever really be negative, but I am using negative numbers to represent front-focusing.
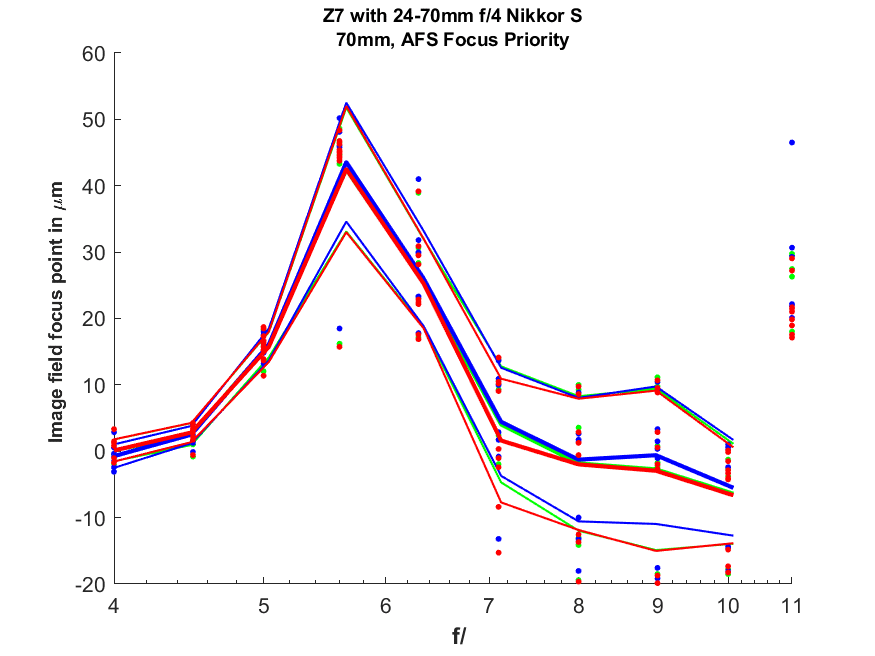
Now let’s look at how well the camera does with automatic focusing using AF-S and user-controlled spot selection.
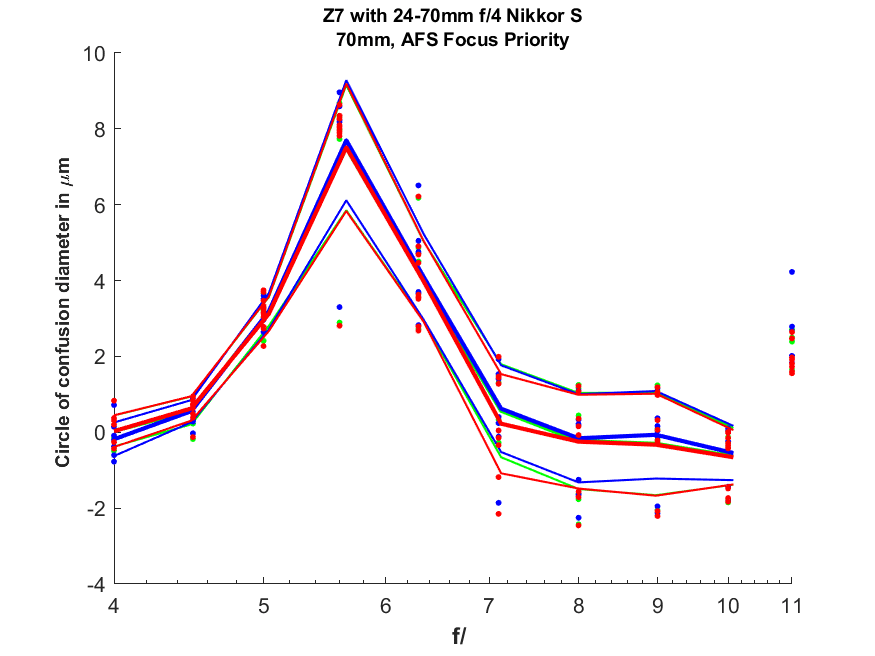
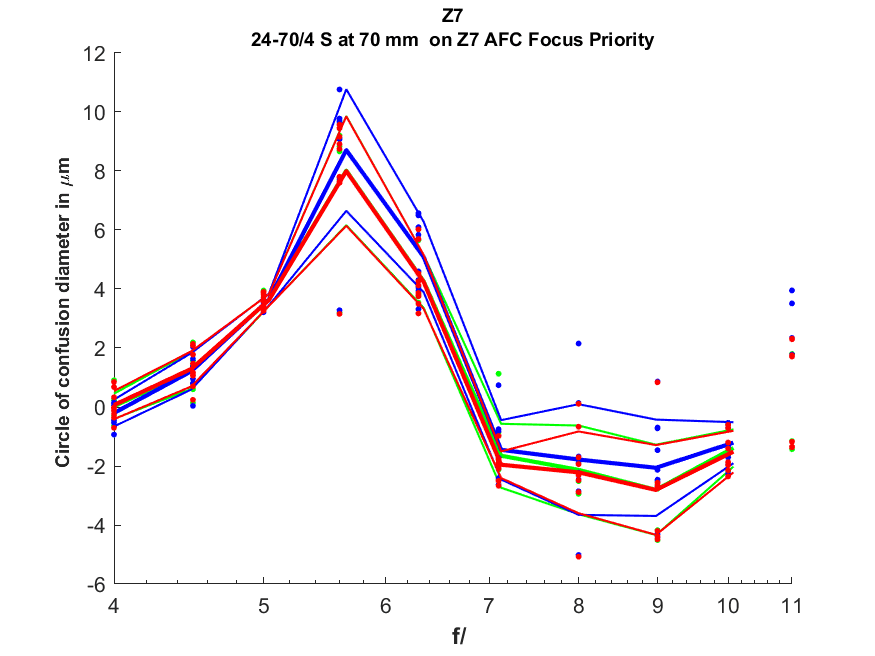
The CoC graph is again more instructive.
The scatter is low, even wide open. The errors are worst at f/5.6 and are back-focused far enough to give CoCs of about two sensor pitches.
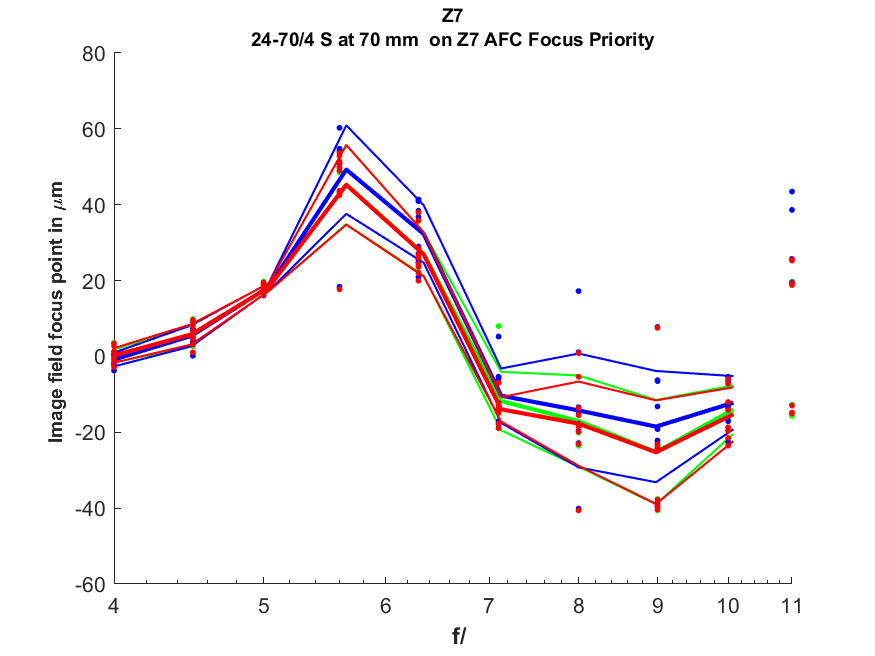
Turning now to AF-C:
About the same as AF-S.
This is good autofocus performance.
Leave a Reply