This is one in a series of posts on the Nikon Z6 and Z7. You should be able to find all the posts about that camera in the Category List on the right sidebar, below the Articles widget. There’s a drop-down menu there that you can use to get to all the posts in this series; just look for “Nikon Z6/7”.
There has recently been some controversy about the relative noise behavior of the Nikon Z6 and Z7 in deep shadows. I am in the process of addressing those differences in a series of posts which will include both quantitative results and visual ones. That series starts here.
Today I’m going to walk you through the conversion of the data from a normal photon transfer curve (PTC) to the normalized signal-to-noise ration (SNR) curves I’m been showing in this series.
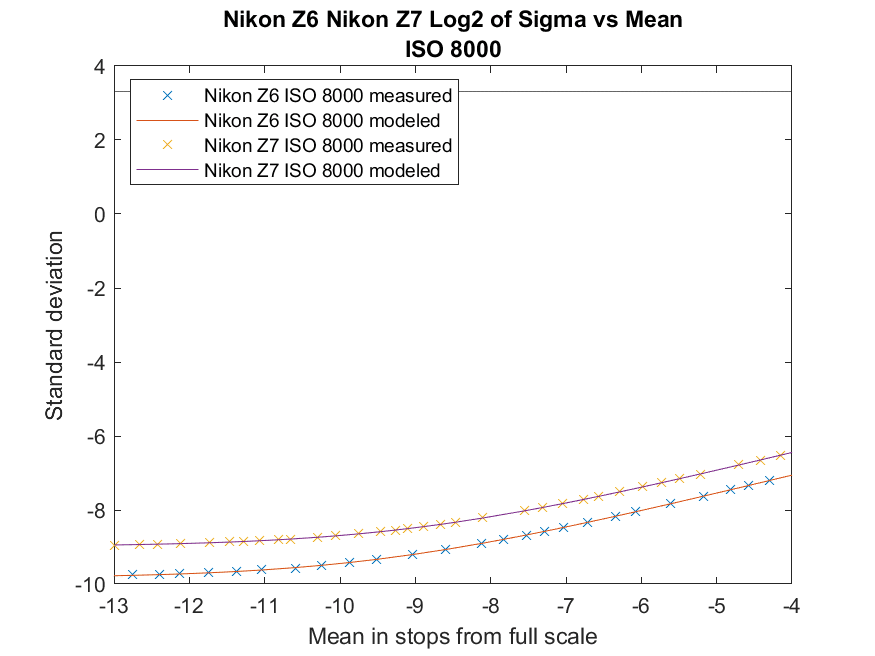
We start out with a normal PTC, with the mean signal on the x axis and the standard deviation, or sigma, or rms noise on the vertical axis:
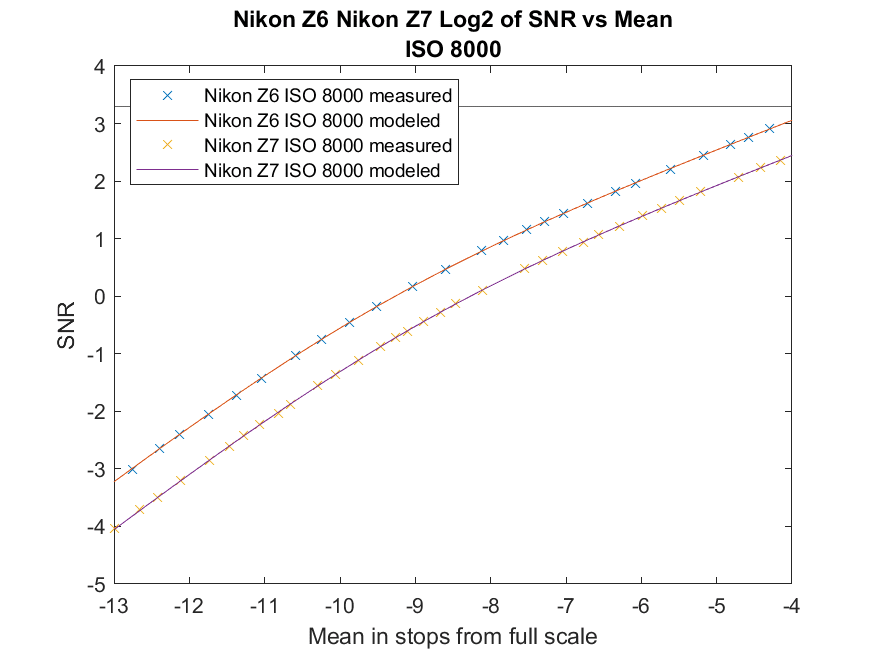
Then we convert the standard deviation to signal to noise ratio:
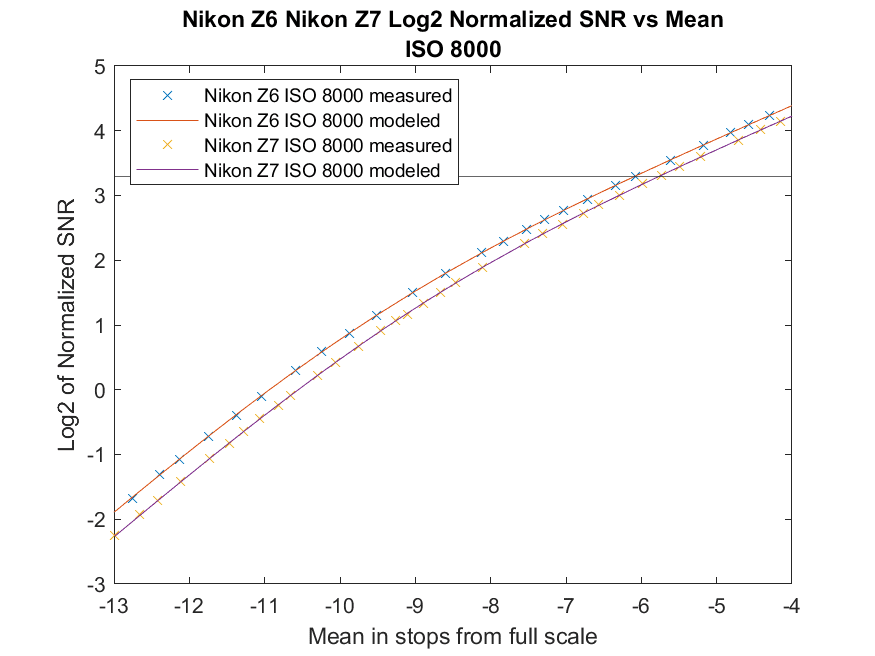
Then we normalize the SNRs to those of a 1600-pixel-high image and we plot the SNR = 10 as a horizontal line that marks the Claff PDR value. This makes the Z7 closer to the Z6, but doesn’t quite close the gap.
see I plotted the line at y = 3.3 in all the graphs. I’ll fix that in subsequent posts. It only belongs in the last one.


Leave a Reply