• site home
  • blog home
  • galleries
  • contact
  • underwater
  • the bleeding edge

the last word

Photography meets digital computer technology. Photography wins -- most of the time.

You are here: Home / The Bleeding Edge / Sony a7R noise floor

Sony a7R noise floor

December 6, 2013 JimK Leave a Comment

I am not completely happy with the preceding two posts. In order to do a better job of characterizing the vibration effects of the a7R’s shutter, I need to get further from the ‘scope, make the light path longer with mirrors (no smoke), or come up with a completely different way of making the measurement.

Instead of letting that hold up the rest of my analysis of the a7R, I’m just going to press on.

The first thing I normally do when I analyze a camera is see if there are self-heating effects that I need to watch out for. If there are, it makes the testing process take a lot longer, since I have to wait between test exposures. Fortunately, these effect have not usually been material.  However, I can’t count of that, so here’s how I test.

I make a series of exposures of the back of the lens cap with the aperture set to the physically smallest opening, the ISO at 3200, and the shutter speed at 1/4 second (if there’s no long-exposure noise reduction at that setting). The file format was raw. With the a7R, with the 80MB/s SD card I used, at ¼ second, the camera’s buffer capacity wasn’t an issue; it is happy to make exposures at about one-second intervals all day long.

I use Rawdigger to analyze the files, and Excel to do the statistics.

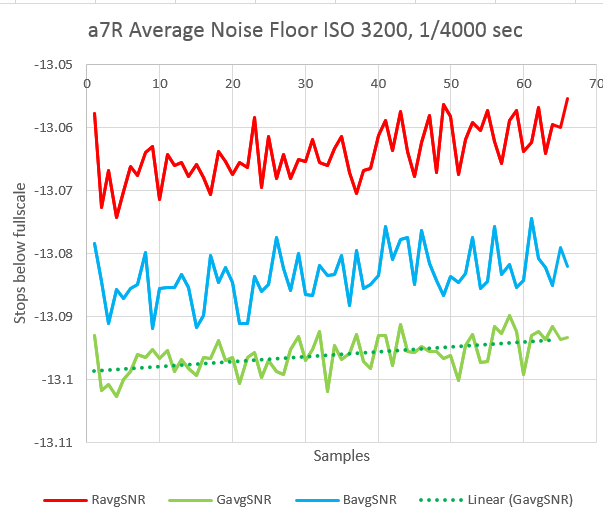
Here’s the average noise floor over 64 exposures. I’ve plotted the red and blue channels, and the average of the two green channels over a rectangle that includes the central 90% of the pixels.

a7r noise 1

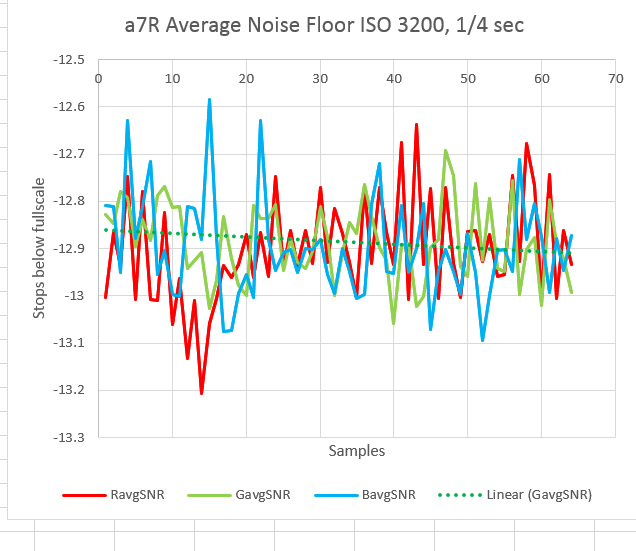
There is no increase in noise do to self-heating at all. In fact, the straight line fit to the green data with least-squares error criterion shows a slight decrease over time.

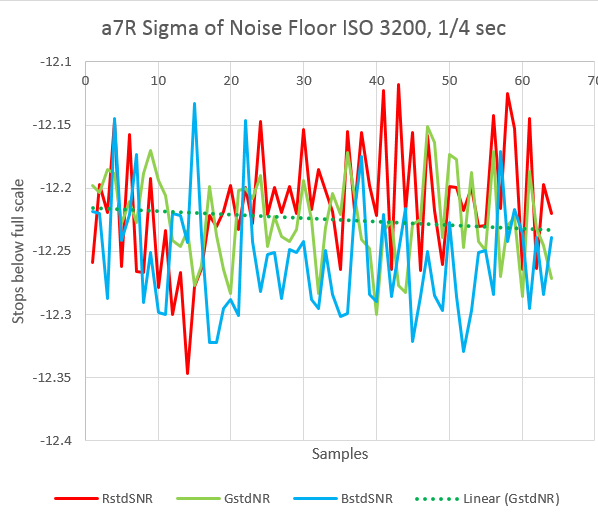
Plotting the standard deviation produces similar results:

a7r noise 2

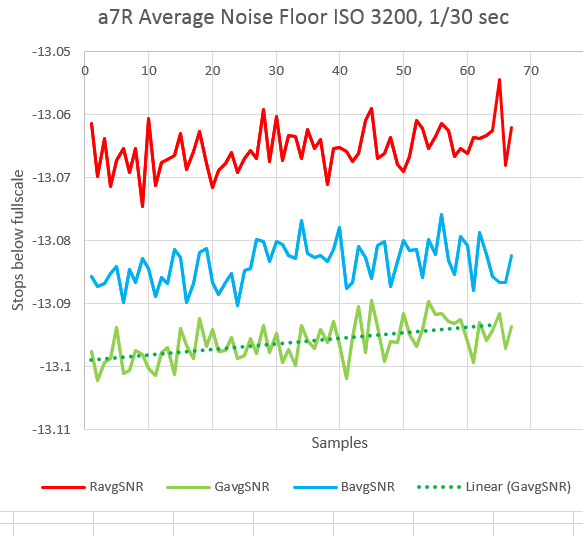
I repeated the results at 1/30 of a second.

The average noise:

a7r noise 3

and the standard deviation:

a7r noise 4

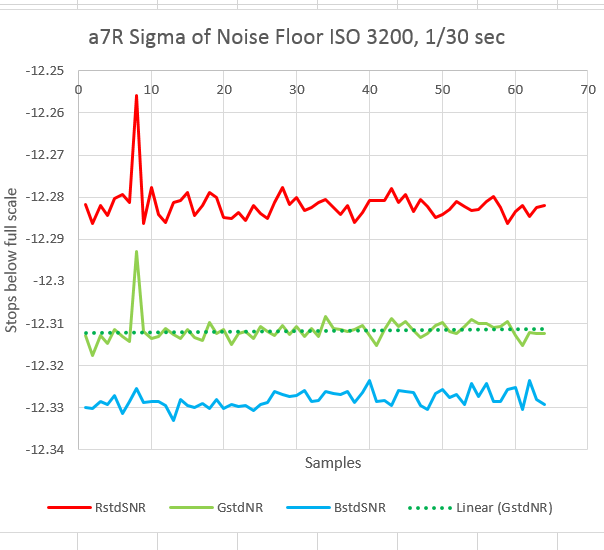
Now there is a little bit of self-heating, but not enough to worry about. There is an odd effect; the noise is different in the three color channels. This has nothing to do with the Color Filter Array (CFA), since there is no light falling on the sensor. The differences are very small, but consistent. I suspect that Sony is doing some channel scaling of the putatively raw data. I’ll keep an eye out for more evidence of this going forward.

For completeness, I looked at 1/4000 second exposures. First, the averages:

a75 noise 5

And next, the standard deviations:

a7r noise 6

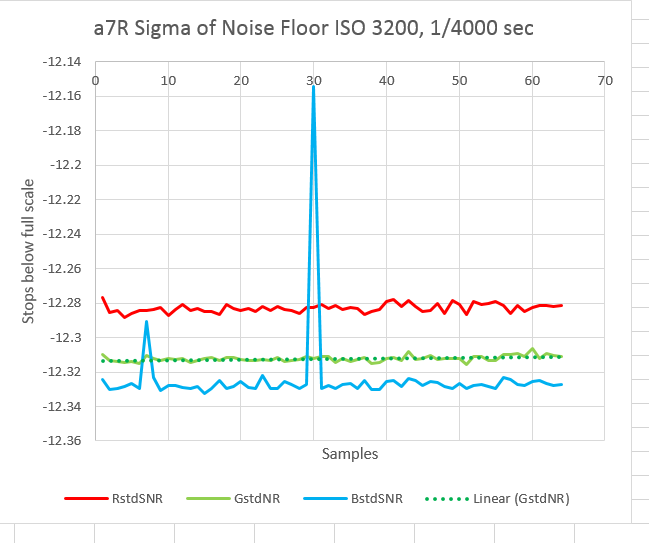
Again, except for the outlier in the blue channel, not much difference.  There’s an inconsequential amount of noise due to self-heating, and we see the same noise differences across the color channels.

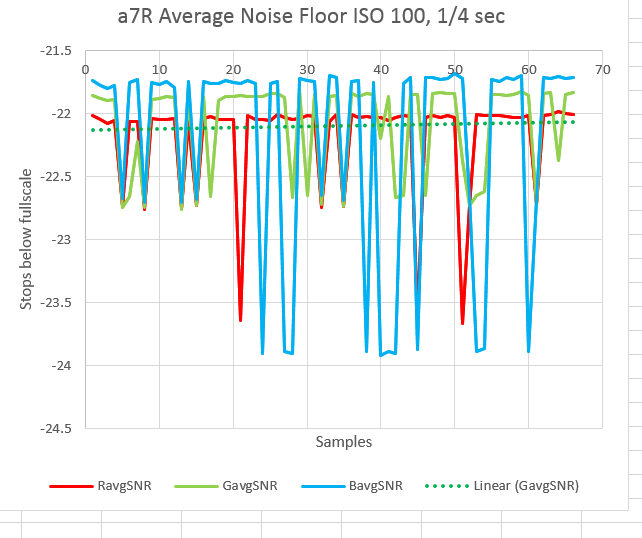
At ISO 100 at ¼ second, there is no measurable self-heating effect, but a lot of statistical jumping around. Note that the average noise level is a lot lower than you’d think it would be – about 22 dB down from full scale. We saw this to a lesser degree with the M240, and I suspected that it was the result of a negative offset ahead of the analog-to-digital converter, and was the cause of the M240’s green shadows.

a7r noise 7

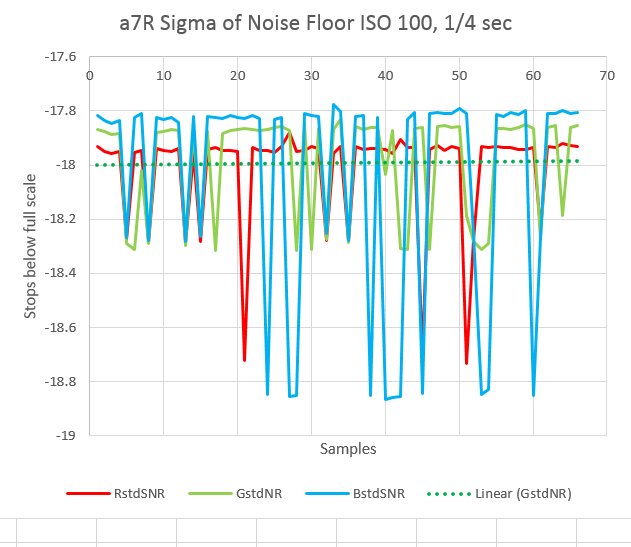
The standard deviation looks similar:

a7r noise 8

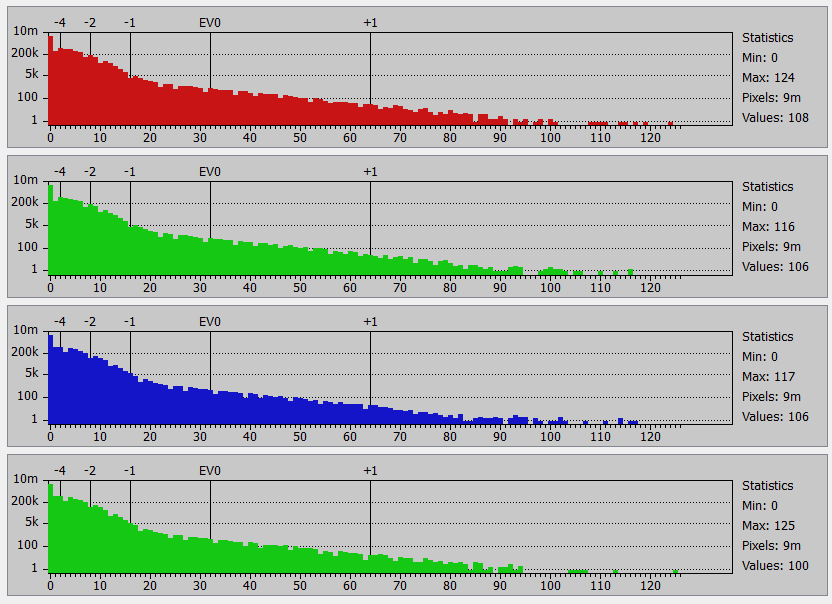
Looking at the histogram of the noise floor at ISO 3200 at 1/30th, we see normal behavior, with no evidence of red and blue channel prescaling (note that the horizontal axis is linear and the vertical axis is logarithmic):

a7r rd 1

The histogram at ISO 200 and 1/30 indicates an incredibly – and I use that word advisedly — low noise floor:

a7r rd 2

No self-heating to worry about.

The Bleeding Edge, The Last Word

← Sony a7R shutter vibration with 135 Telyt Sony a7R noise floor vs ISO →

Leave a Reply Cancel reply

Your email address will not be published. Required fields are marked *

May 2025
S M T W T F S
 123
45678910
11121314151617
18192021222324
25262728293031
« Apr    

Articles

  • About
    • Patents and papers about color
    • Who am I?
  • How to…
    • Backing up photographic images
    • How to change email providers
    • How to shoot slanted edge images for me
  • Lens screening testing
    • Equipment and Software
    • Examples
      • Bad and OK 200-600 at 600
      • Excellent 180-400 zoom
      • Fair 14-30mm zoom
      • Good 100-200 mm MF zoom
      • Good 100-400 zoom
      • Good 100mm lens on P1 P45+
      • Good 120mm MF lens
      • Good 18mm FF lens
      • Good 24-105 mm FF lens
      • Good 24-70 FF zoom
      • Good 35 mm FF lens
      • Good 35-70 MF lens
      • Good 60 mm lens on IQ3-100
      • Good 63 mm MF lens
      • Good 65 mm FF lens
      • Good 85 mm FF lens
      • Good and bad 25mm FF lenses
      • Good zoom at 24 mm
      • Marginal 18mm lens
      • Marginal 35mm FF lens
      • Mildly problematic 55 mm FF lens
      • OK 16-35mm zoom
      • OK 60mm lens on P1 P45+
      • OK Sony 600mm f/4
      • Pretty good 16-35 FF zoom
      • Pretty good 90mm FF lens
      • Problematic 400 mm FF lens
      • Tilted 20 mm f/1.8 FF lens
      • Tilted 30 mm MF lens
      • Tilted 50 mm FF lens
      • Two 15mm FF lenses
    • Found a problem – now what?
    • Goals for this test
    • Minimum target distances
      • MFT
      • APS-C
      • Full frame
      • Small medium format
    • Printable Siemens Star targets
    • Target size on sensor
      • MFT
      • APS-C
      • Full frame
      • Small medium format
    • Test instructions — postproduction
    • Test instructions — reading the images
    • Test instructions – capture
    • Theory of the test
    • What’s wrong with conventional lens screening?
  • Previsualization heresy
  • Privacy Policy
  • Recommended photographic web sites
  • Using in-camera histograms for ETTR
    • Acknowledgments
    • Why ETTR?
    • Normal in-camera histograms
    • Image processing for in-camera histograms
    • Making the in-camera histogram closely represent the raw histogram
    • Shortcuts to UniWB
    • Preparing for monitor-based UniWB
    • A one-step UniWB procedure
    • The math behind the one-step method
    • Iteration using Newton’s Method

Category List

Recent Comments

  • Mike MacDonald on Your photograph looks like a painting?
  • Mike MacDonald on Your photograph looks like a painting?
  • bob lozano on The 16-Bit Fallacy: Why More Isn’t Always Better in Medium Format Cameras
  • JimK on Goldilocks and the three flashes
  • DC Wedding Photographer on Goldilocks and the three flashes
  • Wedding Photographer in DC on The 16-Bit Fallacy: Why More Isn’t Always Better in Medium Format Cameras
  • JimK on Fujifilm GFX 100S II precision
  • Renjie Zhu on Fujifilm GFX 100S II precision
  • JimK on Fuji 20-35/4 landscape field curvature at 23mm vs 23/4 GF
  • Ivo de Man on Fuji 20-35/4 landscape field curvature at 23mm vs 23/4 GF

Archives

Copyright © 2025 · Daily Dish Pro On Genesis Framework · WordPress · Log in

Unless otherwise noted, all images copyright Jim Kasson.