• site home
  • blog home
  • galleries
  • contact
  • underwater
  • the bleeding edge

the last word

Photography meets digital computer technology. Photography wins -- most of the time.

You are here: Home / The Last Word / Another medium tele test — Batis LoCA

Another medium tele test — Batis LoCA

February 24, 2016 JimK 3 Comments

This is a continuation of a test of the following lenses on the Sony a7RII:

  • Zeiss 85mm f/1.8 Batis.
  • Zeiss 85mm f/1.4 Otus.
  • Leica 90mm f/2 Apo Summicron-M ASPH.
  • AF-S Nikkor 85mm f/1.4 G.
  • Sony 90mm f/2.8 FE Macro.

The test starts here.

I am now ready to start showing results for my longitudinal chromatic aberration LoCA) testing. Today we’ll start with the Batis, but I will show you results for the other four lenses in subsequent posts.

Before I get started, I’d like to send out a big “thank you” to Jack Hogan, with whom I sometimes collaborate on technical photographic projects. I had been looking at writing Matlab code to extract the data that I need for the on-axis LoCA studies from Imatest results, but Jack took pity on me and sent me Matlab code that does the following (Jack, if I get any of this wrong, please correct me):

  • Uses DCRAW to decode, but not demosaic raw files
  • Lets the user — moi — pick horizontal and vertical edges and regions for analysis
  • Uses MTF Mapper to analyze the edges on a directory full of files
  • Picks through the MTF Mapper results to report MTF50 values for the red, green, and blue raw planes, plus a white-balanced composite (I’m not using that last one).

So here’s what I did:

I lit the target with two Westcott LED panels, and set the color temperature to 5000K. I mounted a Sony a7RII with a Batis 85/1.8 on it to the Cognisys computer-driven focusing rail. I set the controller up to use 192mm of travel and make 49 exposures 4mm apart. I set the assembly 3.3 meters from the on-axis target, mounted the lens, focused a little towards the back from mid-rail using manual focusing, and exposed at 49-shot series from f/1.8 through f/8.  I used Jack’s program to calculate the MTF50s for all the color planes, imported the data into Excel, and plotted the results  in cycles per picture height vs distance from the point furthest away from the target.

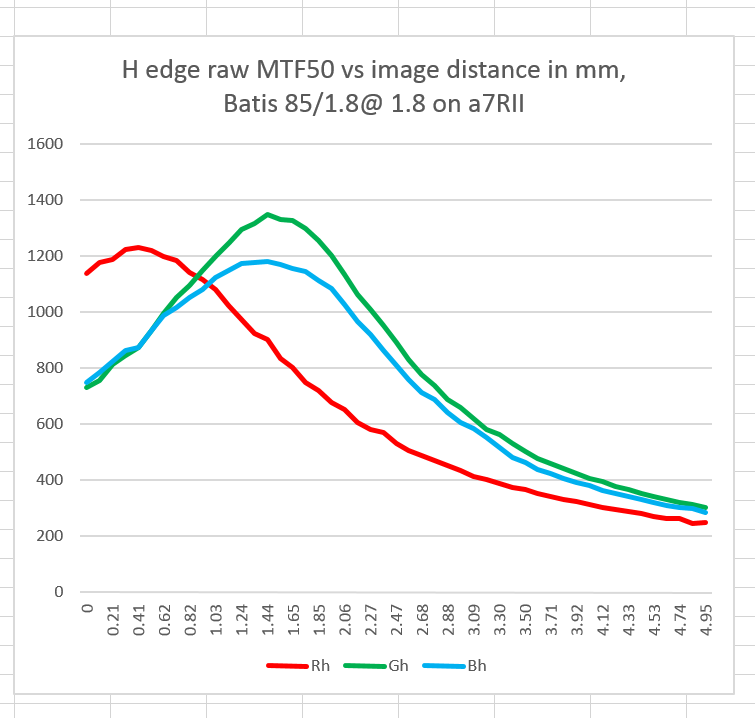
Here’s what I got with a horizontal edge, wide open:

Batis 18 loca sub dist

Distances closer to the target are on the right, and distances further away are on the left. You can see that the red plane is focused about 45mm further away from the target than the green and the blue planes. That is LoCA.

Referring all the measurements to the sensor side which just changes the horizontal axis, we get this:

Batis 18 image dist

Now the LoCA shows a shift that measures about 1 mm.

If we plot the data for the vertical edge in the same way, we get this:

Batis 18 loca v edge Im dist

You can see that the shift between the blue/green and the red curves is about the same, but that both are moved slight to the left. That is call astigmatism. Let’s ignore it for the purposes of this post.

Let’s look at the sensor-referred curves at f/2:

b2h loca

b2v loca

Not much difference.

At f/2.8:

b28 h loca

b28 v loca

We can see everything shifting to the right — that’s the focus shift we were seeing in the earlier posts == but the distance between the peaks seems to be staying constant.

At f/4:

b4h loca

b4v loca

The distance between the peaks is actually getting greater. The folk wisdom about LoCA is that it decreases as you stop down. That is not the case here. I have an explanation for that discrepancy that I’ll get to further on down the page.

At f/5.6:

b56h loca

b56v loca

The green and blue peaks are diverging slightly.

At f/8:

b8 h loca

b8v loca

If the measure of LoCA is the distance between the point of sharp focus for three spectral mixes, than LoCA is not devreasing as you stop down with the Batis. However, as the depth of field gets greater and greater (the curves get flatter) the visibility of LoCA will decrease as you stop down.

More lenses to come.

Thanks, Jack!

The Last Word

← Another medium tele test — Batis and ‘cron focus shift Another medium tele test — Summicron LoCA →

Comments

  1. Jack Hogan says

    February 24, 2016 at 1:57 pm

    Jim, is the x-axis mm or microns? As far as I can remember in-focus is usually measured in units of lambda.

    Reply
    • Jim says

      February 24, 2016 at 2:02 pm

      Millimeters. Approx 85/3300 times subject distance shift. Did I do that right? It gets a bit more complicated as you get closer to the target.

      Reply

Trackbacks

  1. Sony a6300 — AF with Batis 85/1.8 | The Last Word says:
    March 13, 2016 at 1:53 pm

    […] this test, I found that the Batis 85/1.8 lens had moderate focus shift and longitudinal chromatic aberration […]

    Reply

Leave a Reply Cancel reply

Your email address will not be published. Required fields are marked *

May 2025
S M T W T F S
 123
45678910
11121314151617
18192021222324
25262728293031
« Apr    

Articles

  • About
    • Patents and papers about color
    • Who am I?
  • How to…
    • Backing up photographic images
    • How to change email providers
    • How to shoot slanted edge images for me
  • Lens screening testing
    • Equipment and Software
    • Examples
      • Bad and OK 200-600 at 600
      • Excellent 180-400 zoom
      • Fair 14-30mm zoom
      • Good 100-200 mm MF zoom
      • Good 100-400 zoom
      • Good 100mm lens on P1 P45+
      • Good 120mm MF lens
      • Good 18mm FF lens
      • Good 24-105 mm FF lens
      • Good 24-70 FF zoom
      • Good 35 mm FF lens
      • Good 35-70 MF lens
      • Good 60 mm lens on IQ3-100
      • Good 63 mm MF lens
      • Good 65 mm FF lens
      • Good 85 mm FF lens
      • Good and bad 25mm FF lenses
      • Good zoom at 24 mm
      • Marginal 18mm lens
      • Marginal 35mm FF lens
      • Mildly problematic 55 mm FF lens
      • OK 16-35mm zoom
      • OK 60mm lens on P1 P45+
      • OK Sony 600mm f/4
      • Pretty good 16-35 FF zoom
      • Pretty good 90mm FF lens
      • Problematic 400 mm FF lens
      • Tilted 20 mm f/1.8 FF lens
      • Tilted 30 mm MF lens
      • Tilted 50 mm FF lens
      • Two 15mm FF lenses
    • Found a problem – now what?
    • Goals for this test
    • Minimum target distances
      • MFT
      • APS-C
      • Full frame
      • Small medium format
    • Printable Siemens Star targets
    • Target size on sensor
      • MFT
      • APS-C
      • Full frame
      • Small medium format
    • Test instructions — postproduction
    • Test instructions — reading the images
    • Test instructions – capture
    • Theory of the test
    • What’s wrong with conventional lens screening?
  • Previsualization heresy
  • Privacy Policy
  • Recommended photographic web sites
  • Using in-camera histograms for ETTR
    • Acknowledgments
    • Why ETTR?
    • Normal in-camera histograms
    • Image processing for in-camera histograms
    • Making the in-camera histogram closely represent the raw histogram
    • Shortcuts to UniWB
    • Preparing for monitor-based UniWB
    • A one-step UniWB procedure
    • The math behind the one-step method
    • Iteration using Newton’s Method

Category List

Recent Comments

  • bob lozano on The 16-Bit Fallacy: Why More Isn’t Always Better in Medium Format Cameras
  • JimK on Goldilocks and the three flashes
  • DC Wedding Photographer on Goldilocks and the three flashes
  • Wedding Photographer in DC on The 16-Bit Fallacy: Why More Isn’t Always Better in Medium Format Cameras
  • JimK on Fujifilm GFX 100S II precision
  • Renjie Zhu on Fujifilm GFX 100S II precision
  • JimK on Fuji 20-35/4 landscape field curvature at 23mm vs 23/4 GF
  • Ivo de Man on Fuji 20-35/4 landscape field curvature at 23mm vs 23/4 GF
  • JimK on Fuji 20-35/4 landscape field curvature at 23mm vs 23/4 GF
  • JimK on Fuji 20-35/4 landscape field curvature at 23mm vs 23/4 GF

Archives

Copyright © 2025 · Daily Dish Pro On Genesis Framework · WordPress · Log in

Unless otherwise noted, all images copyright Jim Kasson.