This is the 32nd in a series of posts on color reproduction. The series starts here.
It’s been a long, long road, but I’m finally ready to address the question that started this serial discourse on color reproduction, to wit: “What are the differences between Capture 1 and Lightroom default color conversions of Sony a7RII files?”
If you’ve read the studies and explanations that preceded this post, you won’t expect a simple answer. If you haven’t, what follows may confuse you. I will attempt to explain a few things as I go along, but I encourage you to follow the link at the beginning of this post and at least skim the material.
The test conditions are as follows:
- Sony a7RII
- Sony 90mm f/2.8 FE macro
- Two Westcott bicolor LED panels, set to 5000K and full power
- ISO 100
- The C1 free version that only supports Sony cameras, default profile, default control settings
- Lr CC 1015 current version, default profile (Adobe Standard), default control settings
- Both raw processors white balanced to the third gray patch from the right.
- Files exported from both raw processors in Adobe RGB.
- Reference is illuminated in (simulated) D50 light.
- Color adaptation with respect to the D65 white point of Adobe RGB performed using Bradford.
The overall statistics, with the parts that I consider to be worthy of special discussion highlighted in green.
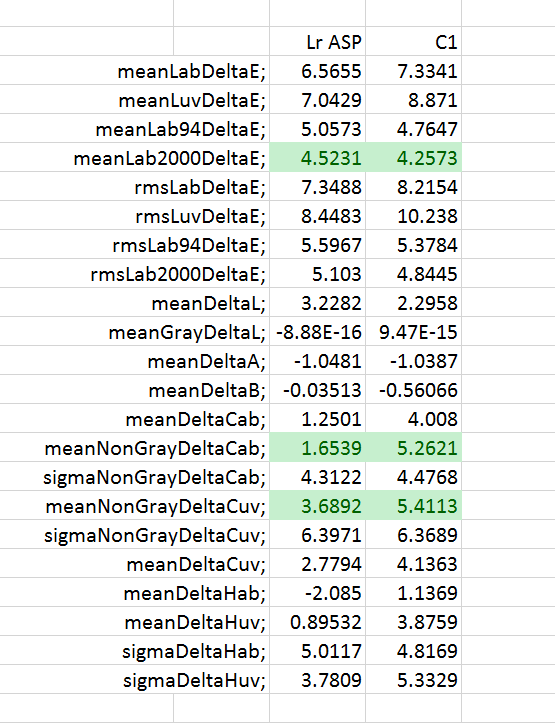
The first thing to notice — the first row with green highlighting — is that the overall accuracy of the two raw developments are quite similar. C1 wins by a nose on Lab 2000 Delta E, and loses by a slightly greater amount on plain old Lab Delta E and a bit more than that on CIELuv Delta E.
The next is that the C1 image is substantially more chromatic than the Lr one. Both processors err in the aggregate on the side of oversaturation, as indicated by the mean non-gray CIELab Delta Cab and Cuv rows. These are CIELab and CIELuv chroma errors; a positive number is oversaturated, and a negative number means undersaturation. The Lr average oversaturation is modest, and the C1 number is substantially higher, though not extreme.
Neither raw processor is linear:
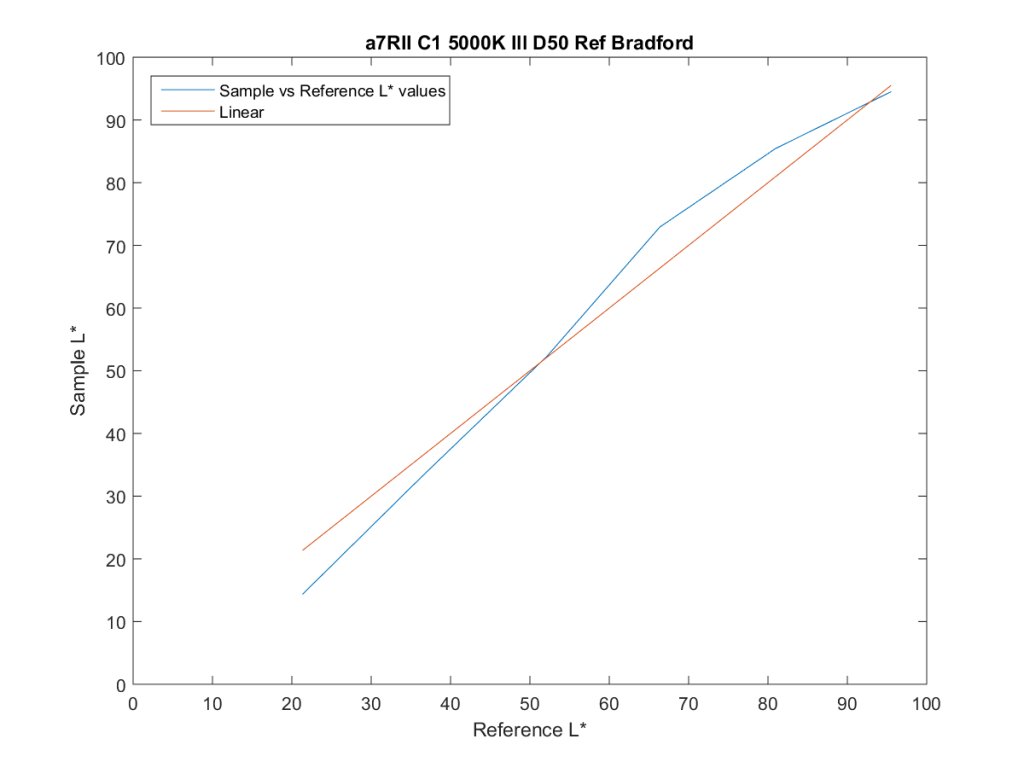
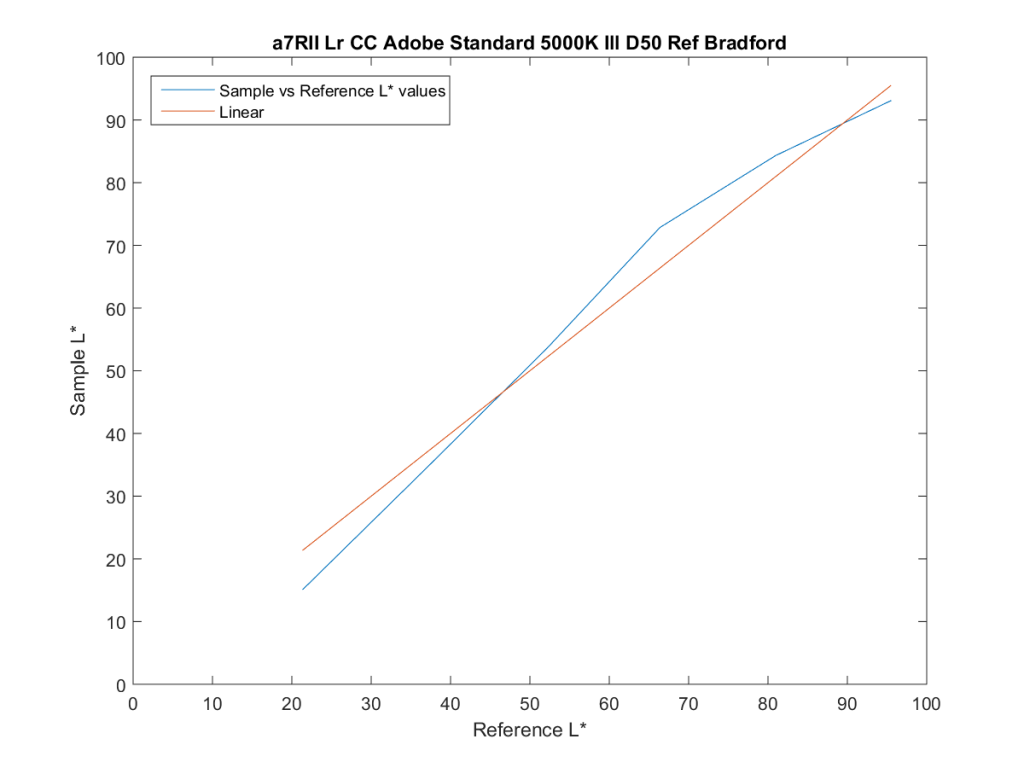
Capture One is on top, with the blue line being the measured luminance readings of the gray patch row versus the correct ones, and the red line being a linear response. Lr is below, with a very similar curve that boosts midrange contrast, depresses shadows, and rolls off highlights. In Lightroom, this behavior comes from the Adobe Standard profile. I don’t know enough about C1 to tell you what part of the program creates this effect. It is almost certainly deliberate on the part of the designers of the two software packages, and it causes the color errors to be larger than they otherwise would be, but probably makes typical images look better to most people.
Now we turn to which color patches have the largest departures from accuracy, as measured in CIELab Delta 2000.
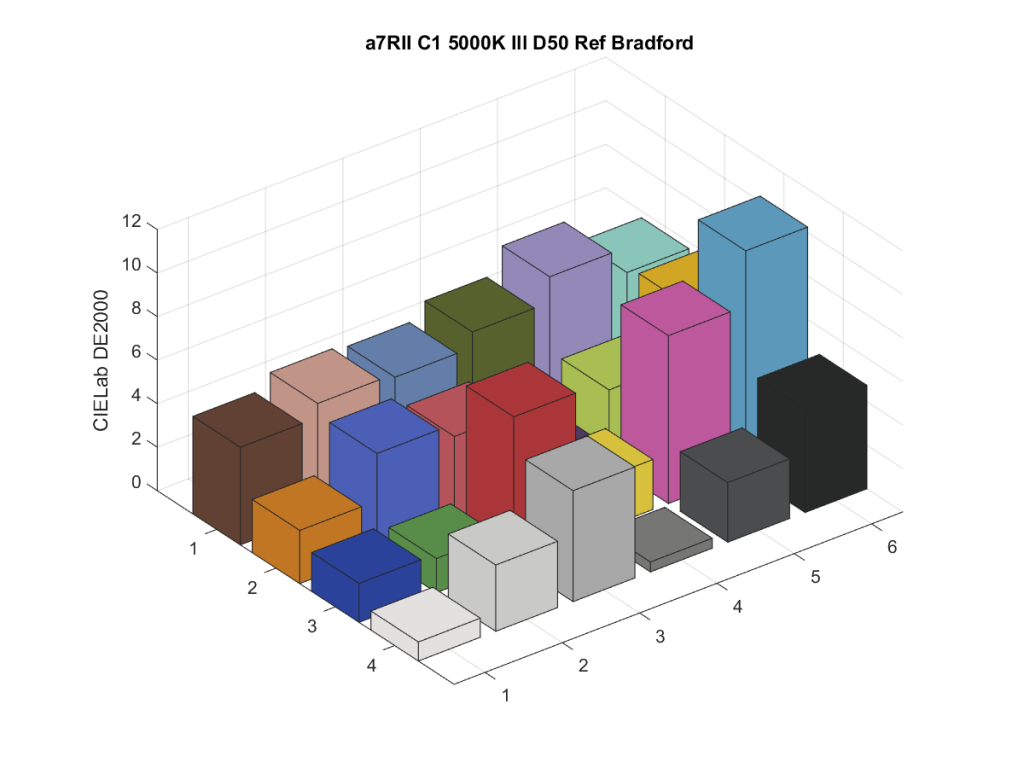
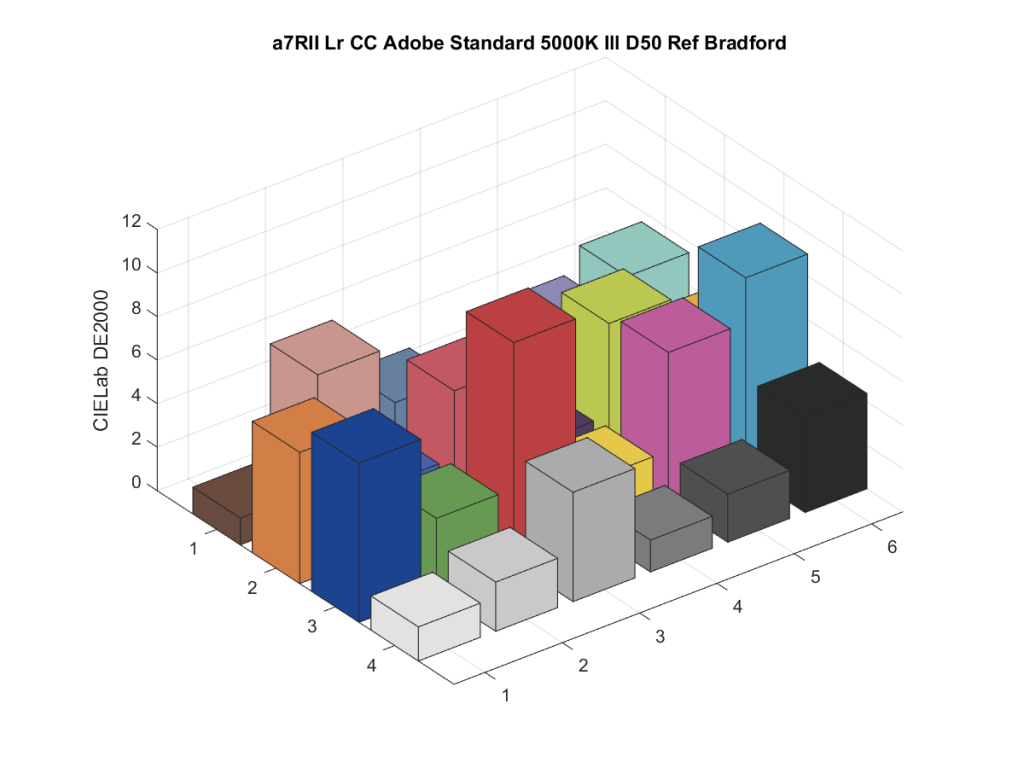
The differences are not striking, and the above plots are only likely to be useful if you have particular colors whose accuracy is important to you.
Now let’s consider chromaticity differences. First, we’ll look at CIE u’v’.
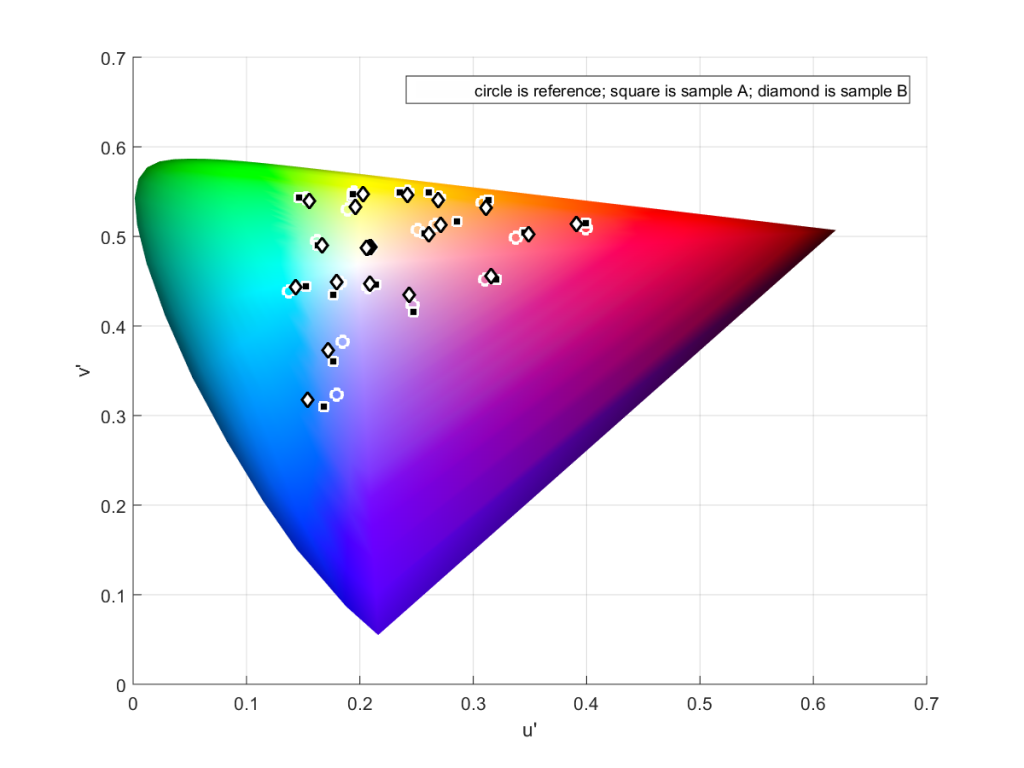
It’s a little hard to see, so we’ll zoom in:
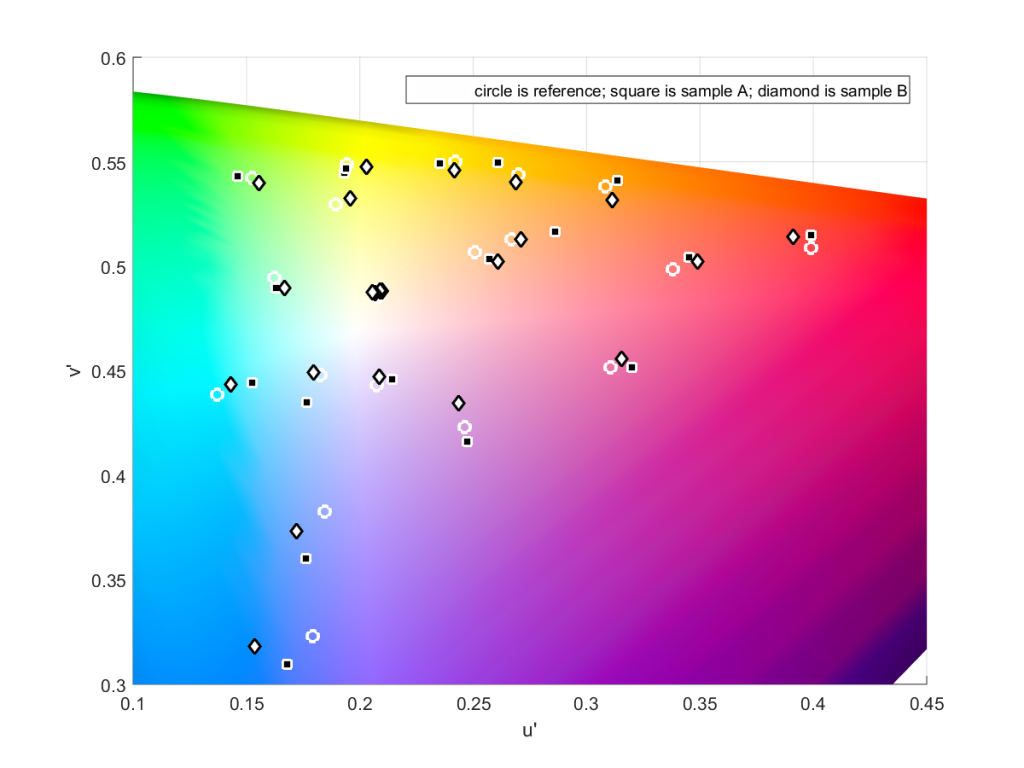
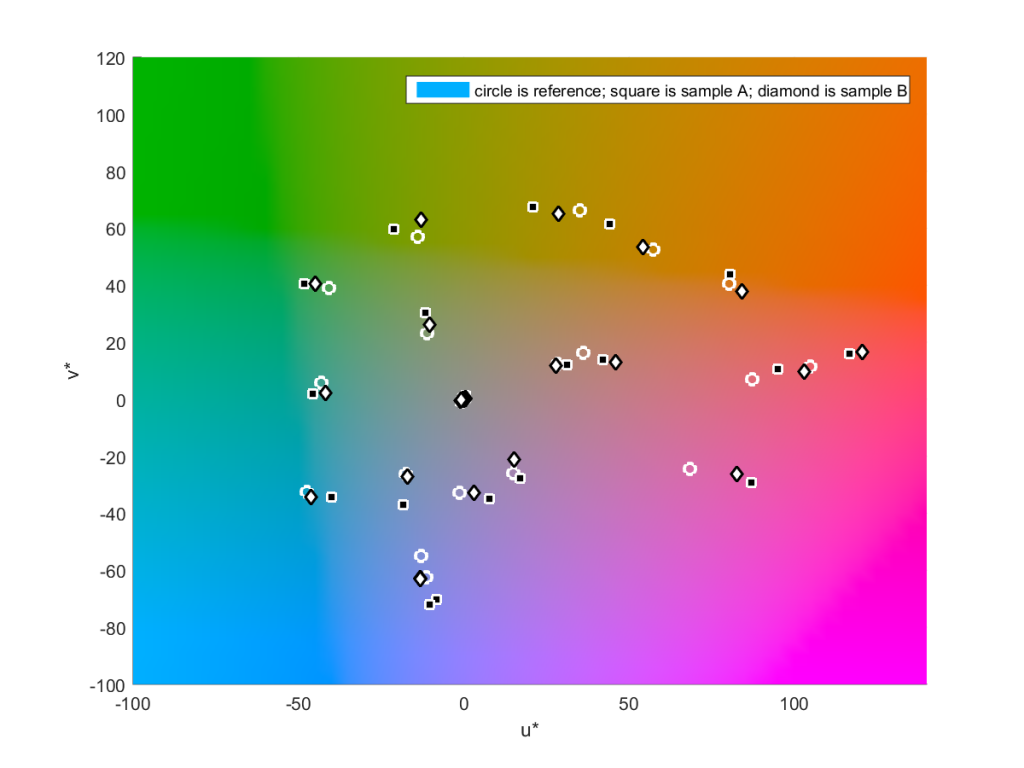
The reference values are the open circles. The squares are the C1 values, and the diamonds the Lr ones.
Take a look at the two bottom triplets, which correspond to the two blue patches. In the case of both C1 and Lr, the rendition is away from magenta, and towards cyan. C1 oversaturates both more than Lr, as is indicated by radial displacement from the white point.
Looking at the same data in the a*b* (chromaticity) plane of CIELab:
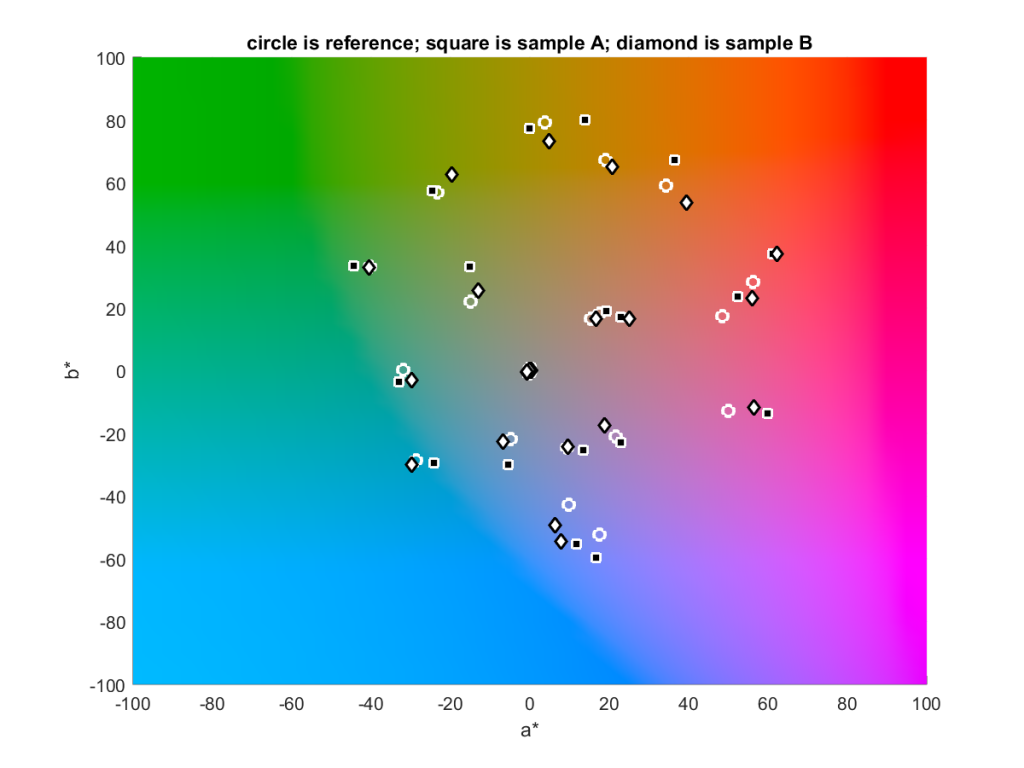
The same management of the blues is apparent, as is C1’s greater shading of Caucasian skin tones in the red direction. C1 also makes the bright yellow patch a great deal more saturated than a strictly accurate interpretation. A C1 shift of the orange patch in the yellow direction is also striking.
And lastly, for those of you out there who speak CIELuv, the same chart in u*v*:
And here’s the big question to those who wondered about the differences between C1 and Lr default processing: does the above data help, or just confuse?
I have three main take-aways from this very informative series:
1) The process of getting to here was eye-opening and an end in itself;
2) No system is out to left field along any one dimension – this is good to know and also an end in itself;
3) When it comes to color, as long as nothing is out to left field what really matters is how pleasing the final result is to you;
4) Given the small differences in final results between the two software packages the choice of which to use seems to be truly subjective and depend solely on personal preferences and efficiency based on one’s typical subjects and workflow.
Given the number of variables involved, could one come up with a qualitative metric such as ‘Excellent’, ‘Good’, ‘Average’, ‘Insufficient’? Is this what SMI attempts to do?
Next question, now that you have isolated the software, is to isolate the camera: using the same raw converter, each camera with a proper profile, how does the D810, say, compare to the a7RII?
Thanks for all this, Jim, truly brilliant stuff!
Jack
Jack, the problem with comparing cameras is that we need to use a profile for each camera, and, if there are differences, we don’t know if it’s the camera or the profile or both. It’s still worth doing, but it’s not clear what to make of it.
Jim
I hear you Jim. Can’t profiles be made to similar criteria? Dcamprof comes to mind http://www.ludd.ltu.se/~torger/dcamprof.html
I’m sorry, this is all very complicated to me. Isn’t Lab 2000 the best way of measuring inaccuracies in color today? If so, even if it wins by a nose but loses more in the other two methods, doesn’t it win in accuracy?
If you’ve got to pick just one, pick Lab 2000. I like to look at Luv, too.