• site home
  • blog home
  • galleries
  • contact
  • underwater
  • the bleeding edge

the last word

Photography meets digital computer technology. Photography wins -- most of the time.

You are here: Home / The Last Word / D810 vs D800E dark-field noise curves

D810 vs D800E dark-field noise curves

August 8, 2014 JimK 1 Comment

Yesterday I posted raw histograms from the Nikon D810 and D800E that showed that Nikon performed aggressive black-level subtraction in the D800E files, while there was very little clipping of the left side of the histogram in most cases with the D810.

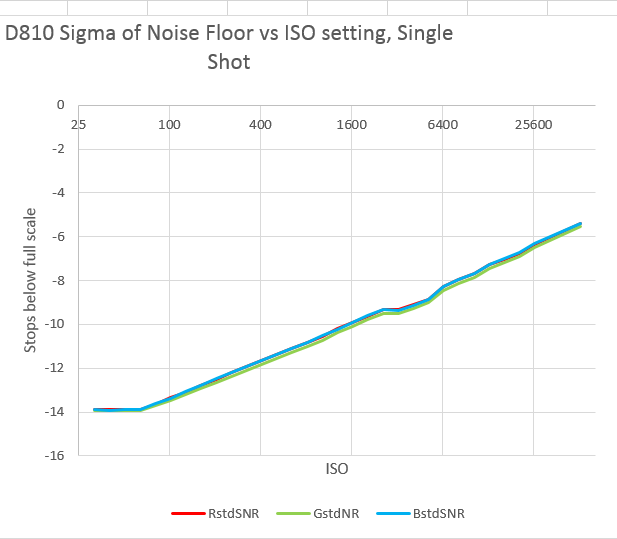
The conventional quick way to measure dark-field noise is to compute the ratio of full-scale to the standard deviation (aka sigma) of the measured dark field noise in the raw files. When you do that with the D810, you get this:

D810 RN

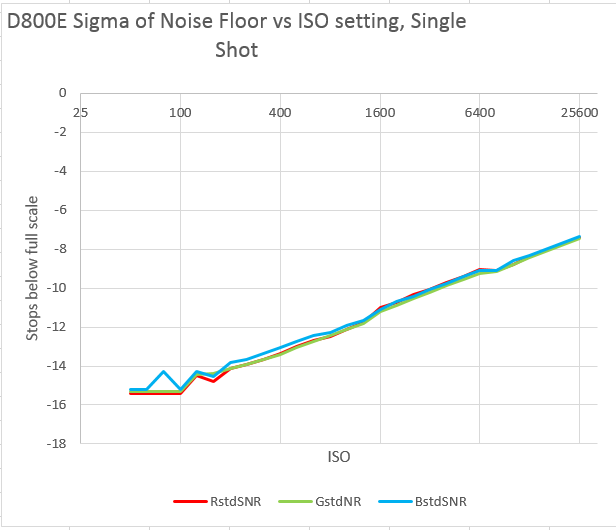
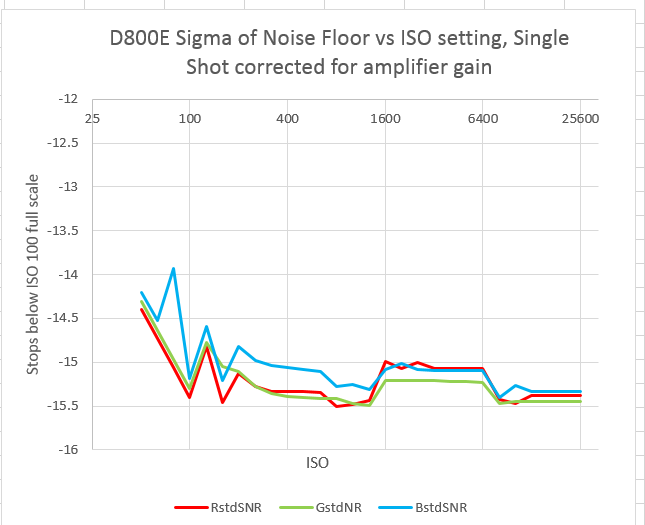
With the D800E, the curve looks like this:

D800E RN

Putting both curves on the same graph, and leaving out the blue and red channels for clarity:

D800E D810  RN

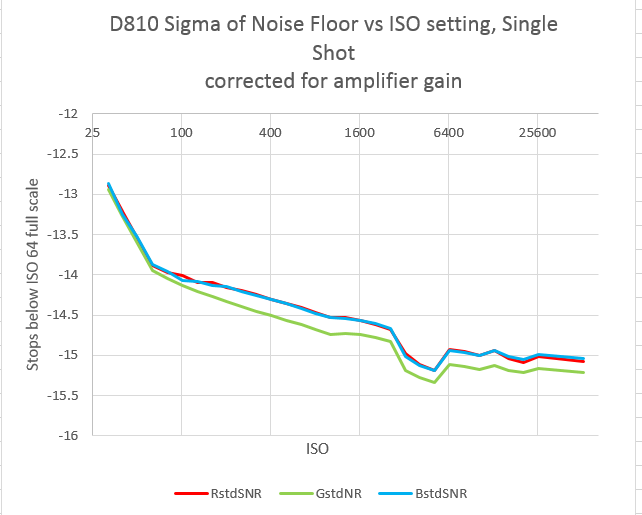
If you correct for amplifier gain, so the noise is referred to the input of the internal amplifiers, the D810 curve looks like so:

D810 RN corr

And the D800E curve is:

D800E RN corr1

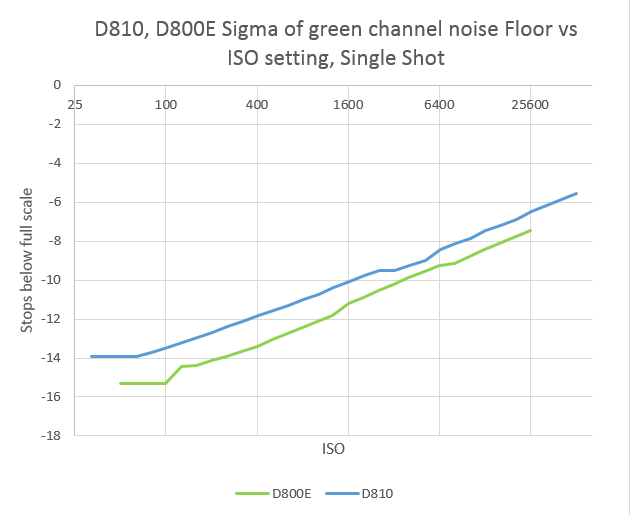
If we plot the green channels of the two cameras on the same graph, we get this:

D800E D810 RN ISO corr

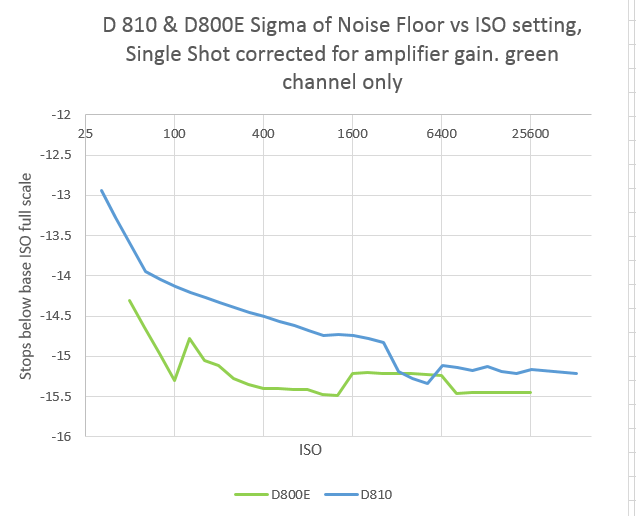
You’ve probably seen graphs like the above on the ‘net, albeit probably not with 1/3 stop ISO resolution. They make it look like the D810 is a step backwards in terms of read noise, except for a few ISO settings at 3200 and above for the D810.

That’s because the cameras play by different rules. The D800E’s internal subtraction of the black level makes the camera’s dark-field noise look better than it really is.

There’s another way to get at read noise. It involves making a series of measurements at ever-decreasing illumination of a target, fitting a curve to the result, and extrapolating it to zero signal. Such methods need to be employed to compare two cameras with such dissimilar raw processing as the D810 and D800E, and even they require some guesswork.

The Last Word

← D810 vs D800E dark-field histograms Motion artifacts in the succulent images →

Comments

  1. HF says

    August 13, 2014 at 4:33 pm

    Hello,
    could this internal subtraction of the black level be the reason
    for possible thermal noise differences between D810 and D800E as described here:
    http://photographylife.com/nikon-d810-thermal-noise-issue ?

    Reply

Leave a Reply Cancel reply

Your email address will not be published. Required fields are marked *

May 2025
S M T W T F S
 123
45678910
11121314151617
18192021222324
25262728293031
« Apr    

Articles

  • About
    • Patents and papers about color
    • Who am I?
  • How to…
    • Backing up photographic images
    • How to change email providers
    • How to shoot slanted edge images for me
  • Lens screening testing
    • Equipment and Software
    • Examples
      • Bad and OK 200-600 at 600
      • Excellent 180-400 zoom
      • Fair 14-30mm zoom
      • Good 100-200 mm MF zoom
      • Good 100-400 zoom
      • Good 100mm lens on P1 P45+
      • Good 120mm MF lens
      • Good 18mm FF lens
      • Good 24-105 mm FF lens
      • Good 24-70 FF zoom
      • Good 35 mm FF lens
      • Good 35-70 MF lens
      • Good 60 mm lens on IQ3-100
      • Good 63 mm MF lens
      • Good 65 mm FF lens
      • Good 85 mm FF lens
      • Good and bad 25mm FF lenses
      • Good zoom at 24 mm
      • Marginal 18mm lens
      • Marginal 35mm FF lens
      • Mildly problematic 55 mm FF lens
      • OK 16-35mm zoom
      • OK 60mm lens on P1 P45+
      • OK Sony 600mm f/4
      • Pretty good 16-35 FF zoom
      • Pretty good 90mm FF lens
      • Problematic 400 mm FF lens
      • Tilted 20 mm f/1.8 FF lens
      • Tilted 30 mm MF lens
      • Tilted 50 mm FF lens
      • Two 15mm FF lenses
    • Found a problem – now what?
    • Goals for this test
    • Minimum target distances
      • MFT
      • APS-C
      • Full frame
      • Small medium format
    • Printable Siemens Star targets
    • Target size on sensor
      • MFT
      • APS-C
      • Full frame
      • Small medium format
    • Test instructions — postproduction
    • Test instructions — reading the images
    • Test instructions – capture
    • Theory of the test
    • What’s wrong with conventional lens screening?
  • Previsualization heresy
  • Privacy Policy
  • Recommended photographic web sites
  • Using in-camera histograms for ETTR
    • Acknowledgments
    • Why ETTR?
    • Normal in-camera histograms
    • Image processing for in-camera histograms
    • Making the in-camera histogram closely represent the raw histogram
    • Shortcuts to UniWB
    • Preparing for monitor-based UniWB
    • A one-step UniWB procedure
    • The math behind the one-step method
    • Iteration using Newton’s Method

Category List

Recent Comments

  • bob lozano on The 16-Bit Fallacy: Why More Isn’t Always Better in Medium Format Cameras
  • JimK on Goldilocks and the three flashes
  • DC Wedding Photographer on Goldilocks and the three flashes
  • Wedding Photographer in DC on The 16-Bit Fallacy: Why More Isn’t Always Better in Medium Format Cameras
  • JimK on Fujifilm GFX 100S II precision
  • Renjie Zhu on Fujifilm GFX 100S II precision
  • JimK on Fuji 20-35/4 landscape field curvature at 23mm vs 23/4 GF
  • Ivo de Man on Fuji 20-35/4 landscape field curvature at 23mm vs 23/4 GF
  • JimK on Fuji 20-35/4 landscape field curvature at 23mm vs 23/4 GF
  • JimK on Fuji 20-35/4 landscape field curvature at 23mm vs 23/4 GF

Archives

Copyright © 2025 · Daily Dish Pro On Genesis Framework · WordPress · Log in

Unless otherwise noted, all images copyright Jim Kasson.