First off, let me dissuade you from one possible – and erroneous – interpretation of the findings of the last post: “Well, gee, if the sensor can’t resolve all of the detail that my lens can put out at f/8, why don’t I just stop down to f/16, where it will be balanced, and I’ll get better pictures.” The reason why this statement is wrong is that the effects of sensor resolution and lens resolution are multiplicative, and they come on slowly. Thus, a diffraction-limited f/8 lens on your D800E sensor will show worse results (except for greater freedom from aliasing) when stopped down to f/16, even though it’s balanced there.
Similarly, you won’t get better results when your lens is stopped down to f/32 by going from a sensor with a 5 micrometer sensel pitch to one with a 8.5 micrometer pitch (assuming the same sensor dimensions), even though it will be close to balanced there.
The idea of imaging system Q is useful when designing the entire system, where you can pick both the lens and the camera resolution independently. Thus, it is relevant to the question, “How much more resolution would be reasonably useful given a particular f-stop.” The word “reasonably” is important, because more resolution is always at least marginally useful. It is also relevant to the question, “How far down can I stop without losing too much resolution?” The words “too much” are important, because stopping down – providing the lens is diffraction limited – will always at least marginally reduce resolution.
Now, let’s talk about the assumptions that went into the construction of the measure Q.
The first is that the sensor has no anti-aliasing (AA) filter. As mentioned before, if you’re using a D800E, a Sony a7R, any digital Leica, any (I think) Foveon camera, and any (again, I think) medium format digital camera, that assumption is valid. If your camera does have an AA filter, how does that affect the way you should look at Q? The AA filter reduces the effective resolution of the sensor. However, I’ve never encountered an AA filter so aggressively tuned that it actually lowers the sensor cutoff frequency to below half the inverse of the sensel pitch. So I’d say the idea of Q applies to cameras with AA filters. You might keep in mind that your sensor MTF has been reduced by the AA filters at spatial frequencies around half of the sensor cutoff frequency, and you can therefore have a bit more sharpness in the image from the lens without aliasing.
The next assumption is that the lens is diffraction-limited. This is in general not accurate for lenses used in normal photography. However, for excellent quality, well focused single-focal-length lenses used at f/8 (maybe f/5.6 in some cases) and physically-smaller stops, it is probably a reasonable assumption, and with today’s Micro-Four-Thirds and up sensors, the pitch isn’t fine enough for us to be able to do justice to diffraction-limited lenses at physically larger f-stops even if we had them.
The last assumption is that the image sensor is monochromatic. This is wrong unless you’re an astronomer, you have a Foveon camera, or you’re using a Betterlight scanning back. The rest of us, stuck with the Bayer Color Filter Array (CFA) or one of its relatives, have to deal with the fact that the basic sensel pitch is finer than the sampling grid for each raw color plane.
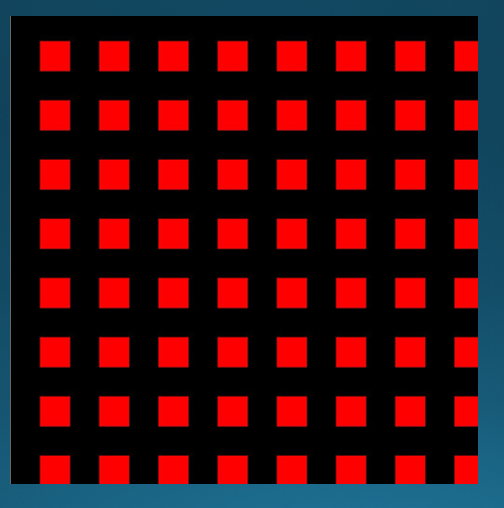
Let’s consider the green plane first:
In the diagonal directions, the green plane samples every possible sensel position. Since the pixel pitch in a diagonal direction is 1.414 times the pixel pitch in the horizontal or vertical direction, we could adjust our system Q by dividing by that number. In the horizontal and vertical directions, the green plane samples ever other sensel. We could perform a Q adjustment for that by dividing by 2.
So, for the green plane, if we’re looking for a typical number, we’d compute the Bayer Q by dividing the mono Q by the average of 1.4 and 2, or 1.7. If we’re looking for a worst case number, we should decide by two, but we should also use the worse-case wavelength, not the average, as we have been doing. I’ll stick with averages for the rest of this post.
In the case of the blue and red raw planes:
We’re sampling at every other sensel, and should divide the mono Q by 2. However, since the red and blue planes go principally to chromaticity calculations and the green plane to luminance, and luminance sharpness is what’s important here, I’d argue for leaving the correction factor at 1.7.
Another way to deal with the CFA in Q calculations is to say that the lens diffraction should be great enough so that all four pixels that make up the Bayer kernel are exposed to essentially the same light. That would argue for corrections of at least 2, and more as the definition of “essentially the same” gets stricter.
The opposite approach is to look at the MTF curves of slanted edge tests with not-very-high-resolution cameras and great lenses and see that the camera is resolving luminance at pretty much the sensel level. This means that the red and blue sensels are contributing enough luminance information so that the correction should be one.
Next, I’ll work through some examples, using a Q corrections of 1 and 1.7.


What about 3-chip cameras? Yes the prism or dichoic mirrors will be in the light path, but how much will they degrade the image WRT the ability to use “all” the light and have all pixels contributing to resolution?
They’d be analyzed the same way as three monochromatic cameras.