This is the 27th in a series of posts on color reproduction. The series starts here.
The day before yesterday, I posted a series of analyses of Macbeth ColorChecker images that showed that repeatablility was very good when the lighting, the camera position, and the exposure remained constant.
However, we’ve see before in this series of posts that exposure can affect the results significantly, and that, with Lightroom and the Adobe Standard profile, that it’s difficult to remove these effects after the fact. Today, I’m reporting on the results of a series of test designed to find out in more detail how exposure affects the Macbeth chart analyses, and what, if anything, can be done about it.
Here’s the set-up. The camera was the Sony a7RII. The lens the Sony 90mm f/2.8 FE macro. The lighting was two Westcott LED panels on full, with the color temperature set to 5000K. The simulated reference was lit with D50 light. I developed in Lr with Adobe Standard profile, and all controls at their default settings except that I white balanced to the third gray patch from the left. I computed the mean and standard deviation (sigma) of a bunch of aggregate color measures. I made eleven exposures. The first exposure was with the light sources on full. The next was with them set to 95%. The third was at 90%, and so on all the way to 50%.
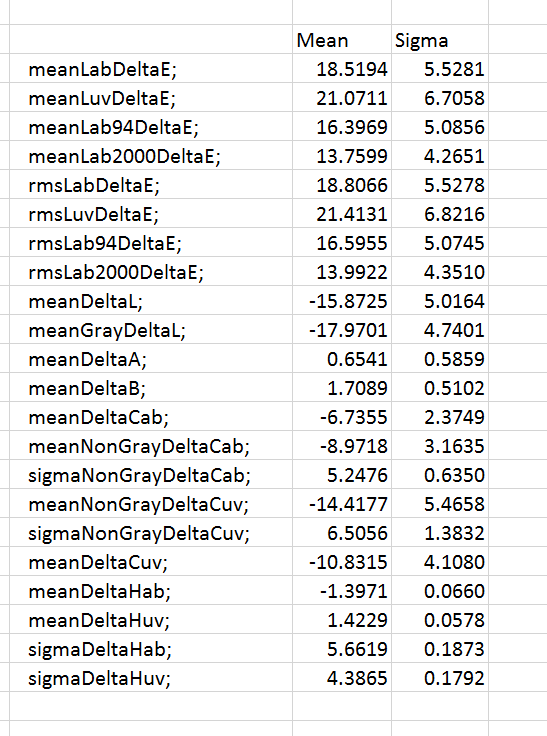
Here are the stats for the whole series:
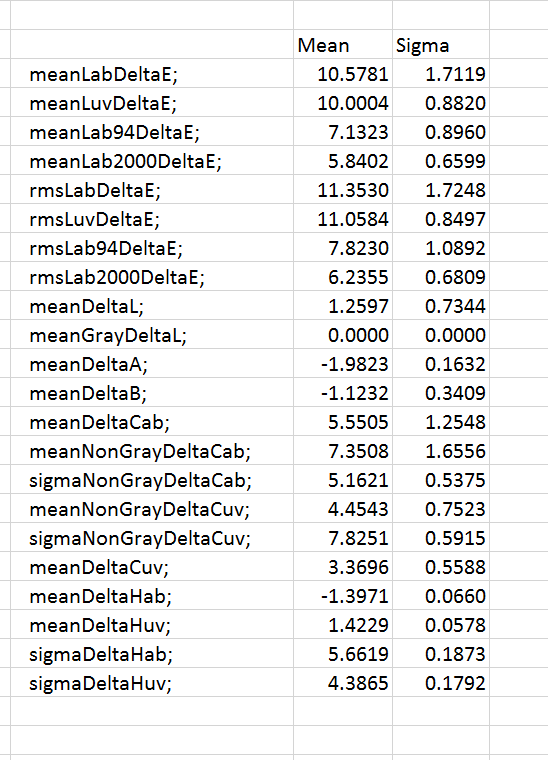
Sigma stands for standard deviation. The lighting effects, as evidenced by the standard deviations, are significant, and not just for luminance errors. If we have the analysis program correct for luminance differences in the six gray patches, we get this:
The improvements are pretty impressive, considering the nonlinearity introduced by the Adobe Standard profile.
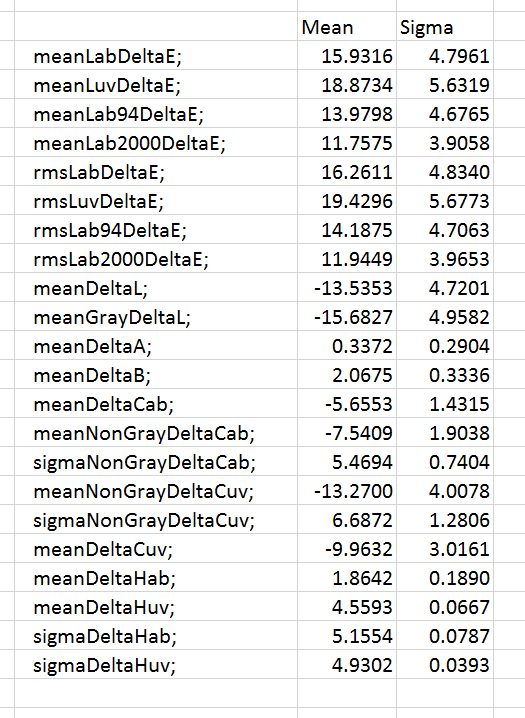
A reader provided me with a linear version of the Adobe Standard profile. When I use it and make some exposure compensations in Lr (the same for each image) and use PV 2010 to keep additional nonlinearities from being introduced I get this:
A little better than the Adobe Standard variation, especially in chromaticity.
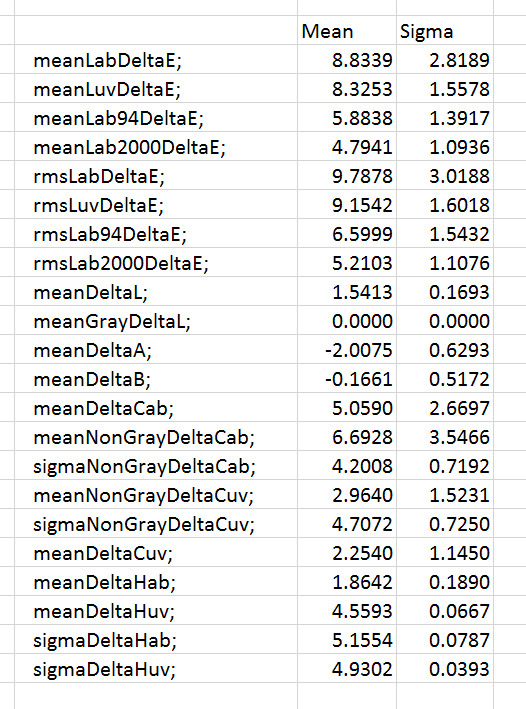
Adding exposure compensation to the analysis processing, we get this:
Oops. We’ve actually made some of the chromaticity standard deviations worse, although the Delta E’s are quite respectable for such a large exposure range.
[The following was added on 2/1/16]
I found out what the problem was with the linear profile. It wasn’t linear. Here are the linearity curves for the greatest exposure:
And for the 11th exposure, which was a full stop down:
See the next post for results with a much more linear profile.


[…] Yesterday I posted the results of making color accuracy assessments of Macbeth chart images exposed …The results were quite poor, if the criterion is that exposure should not affect the results after correction by the analysis tool. It is understandable that the nonlinear Adobe Standard profile should have this problem, but a linear profile should not. […]