Over the past two weeks, I’ve done a series of read noise analyses on an exhausting, if not exhaustive, ground of cameras. I’ve done to build up a data base for correlating visible read noise phenomena with measurements. Today I’d like to start looking at read noise in photographs.
Before I do this, I’d like to give you my personal perspective on read noise. It hasn’t bothered me for years. I just don’t see it in my work. My idea of the minimum usable signal-to-noise ratio (SNR), is about ten to one. With that much photon noise, each pixel is collecting about 100 electrons, and with read noise at a few electrons, or maybe ten or twelve at worst, it’s increasing the photon noise by less than 50%.
People have told me repeatedly that such a view is shortsighted, that read noise is more objectionable than photon noise, which is white and Gaussian. That’s why I started doing the testing that has filled my posts for the last two weeks. And guess what? I’ve proved to myself, and to you all I hope, that read noise has more low frequency components than white noise, and that, with some specialized filtering, it can be seen to be something that you don’t want in your images.
But is that ugliness manifested in post processing that is not as specialized as the Matlab scripts that crunched the data graphed and the images shown in the last few posts? I attempted to find out.
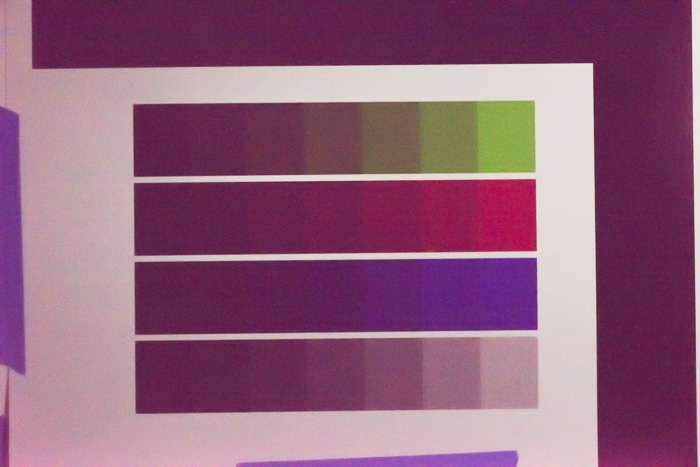
I constructed a target image consisting of what and black areas, plus step wedges in red, green, blue, and gray. I lit it with a Fotodiox 5500K LED source. I put a Zeiss 135mm f/2 APO Sonnar on a Nikon D810, and put a Heliopan variable neutral density filter on the lens. I set the aperture to f/16 or f/22, and dialed in enough ND to have the average exposure pretty far down in the mud. Then I made a series of exposures at shutter speeds from 1/60 to 1/8000 at ISOs from 64 to 12800. I’m going to show you some of those.
You’re not going to see the ones with ISOs below 3200, because they’re pretty darn boring from the read noise perspective, at least with the post processing that you can do in Lightroom. I suppose I could have brought the images into Photoshop and really tortured them, but that wouldn’t represent any possible realistic scenario.
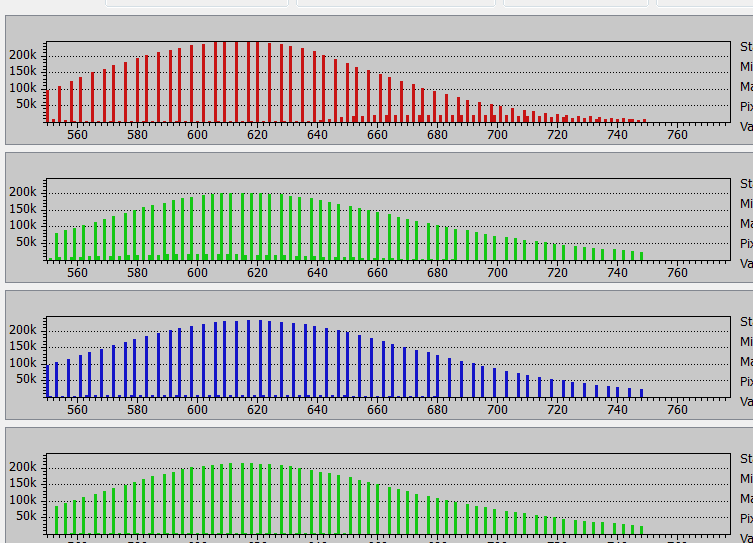
Before we look at the histograms of the images that I’ll be showing you, let’s look at a set from an ISO 3200 image with two stops more exposure than the one you’ll be seeing.
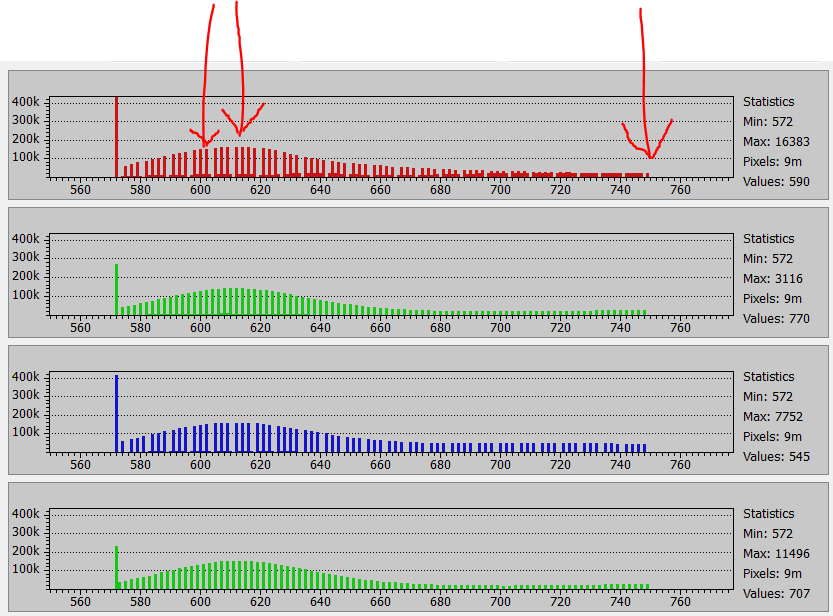
I’ve marked some important levels. The left-most arrow is the black point for the camera. The arrow to its right is the average exposure in the black areas of the test image. There’s about a 10-count difference. What’s that mean in terms of electrons in the sensor? Since the unity gain ISO of the D810 is a bit over 300, that means that at ISO 3200, each count, on average, is 1/10 of an electron. So the black level on the sensor is about 1 electron.
Now look at the right-most arrow. That marks the white point, and it’s about 150 counts, or 15 electrons, over the black point.
Here’s the RawDigger histogram of an ISO 3200 image with two stops less exposure:
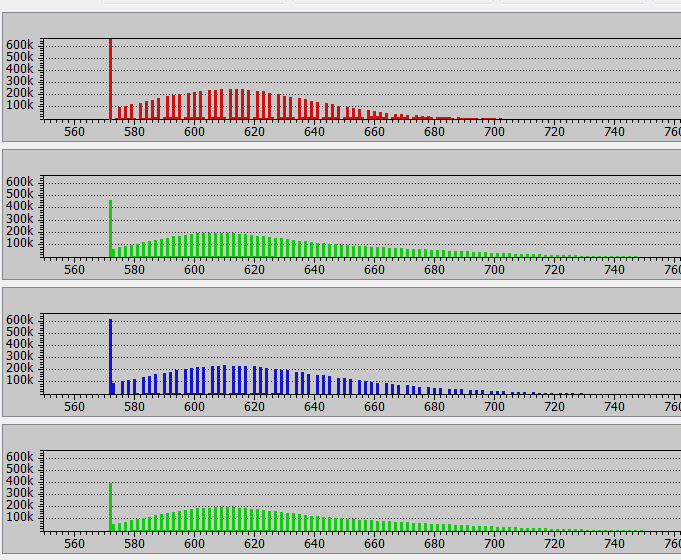
Note that the D810 cuts off part of the left side of the histogram. Two stops is a factor of four, so the black parts of the image must have an average exposure of 1/4 of an electron, and the lightest parts about four electrons. We are well below my 100-electron minimum level for the kind of photographic qualities that I like.
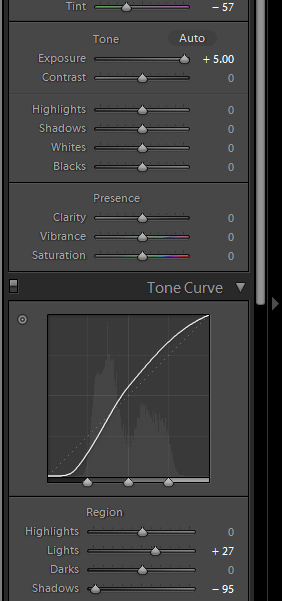
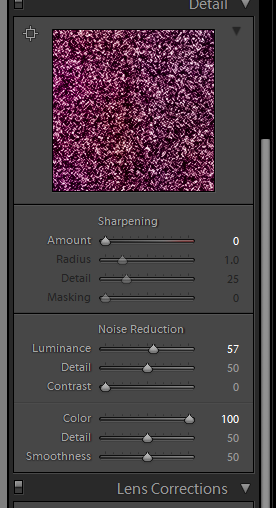
I brought that image into Lightroom, and applied the following aggressive post-processing:, with sharpening and noise reduction turned off
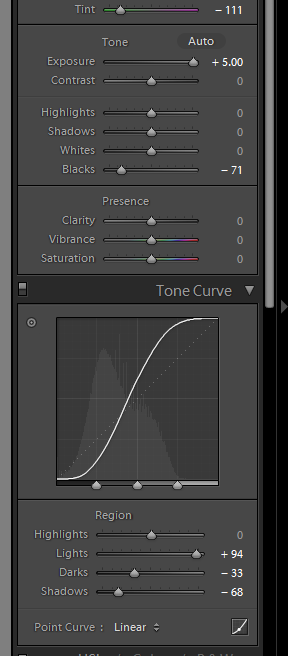
Note the 5-stop exposure boost!
Here’s the image that results:
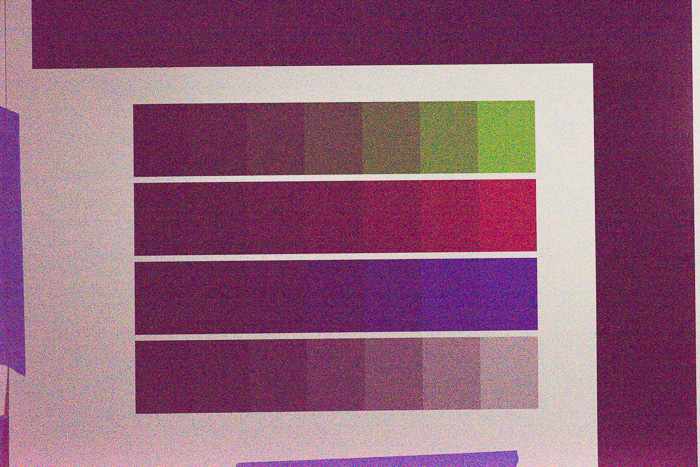
You’re looking at a 640×480 JPEG’d version, but I can tell you that there is virtually no visible evidence of low frequency noise.
One of the things that I did previously to make the read noise more visible was to apply low-pass filtering to the dark-field images. Lightroom’s noise reduction algorithms have a low-pass component, so I tried a ham-fisted LR NR move:
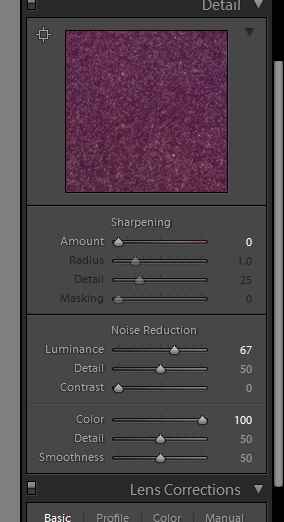
That got me this:
The D810’s pattern noise is MIA.
OK, what if we raise the stakes to ISO 6400? Here’s a raw histogram:
The white point of the image averages 2 electrons/pixel, and the black point about 1/8 of an electron.
In Lightroom applied this delicate adjustment:
And got this image:
There’s plenty of noise, but not much low-frequency noise.
With this noise reduction:
We get this image:
Now we’re starting to see a little low-frequency read noise. Look at the light band across the bottom.
Next stop, ISO 12800 (done with a different setup, and no ND filter):
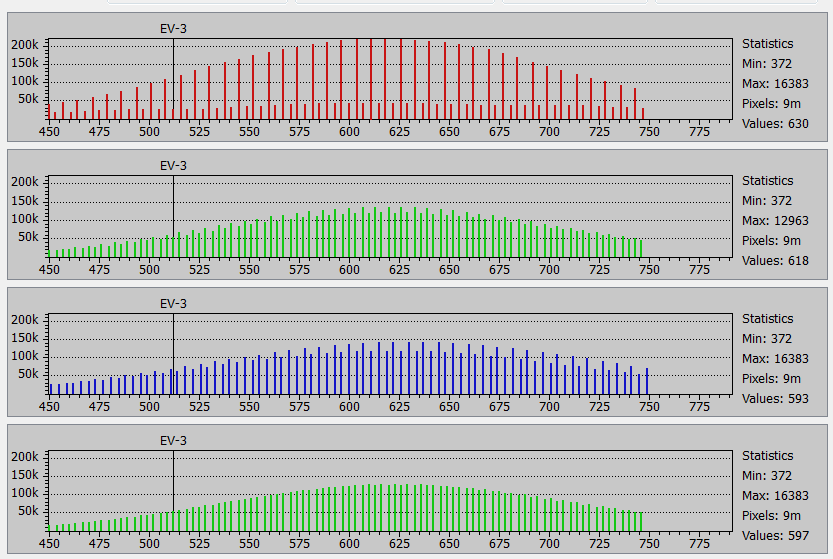
The white point of the image averages 1 electron/pixel, and the black point about 1/16 of an electron.
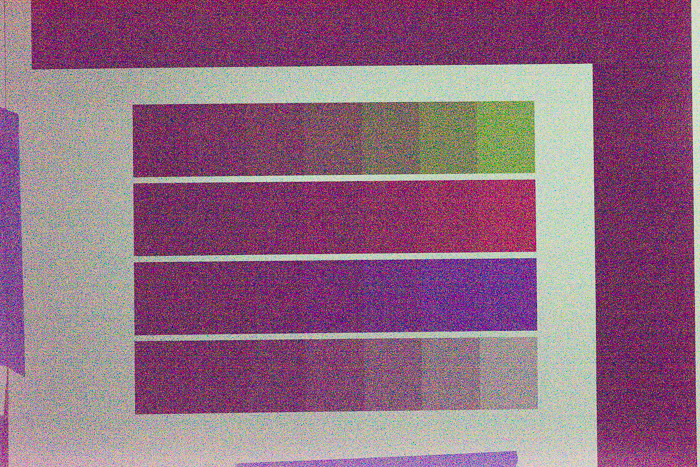
With this heroic move in Lightroom:
We get this image:
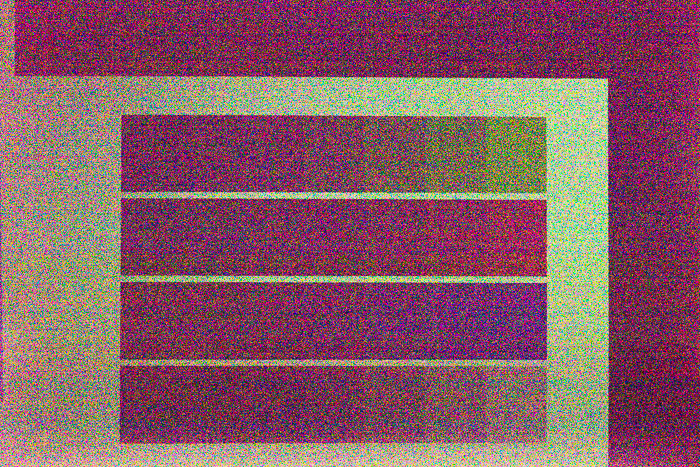
At last, the low frequency read noise is obvious: the light band at the bottom, the dark band above it, and other, mostly horizontal, patterning.
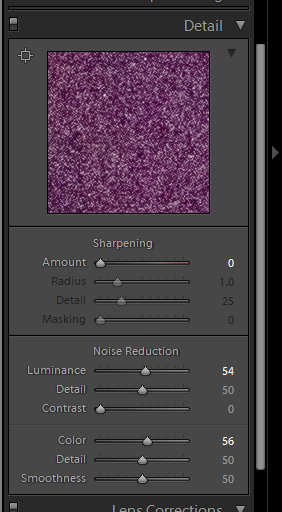
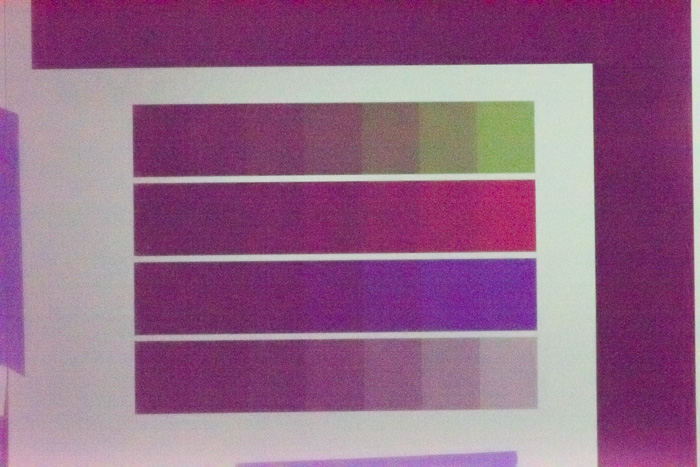
With this noise reduction (and a tweak to the white balance):
We get this image:
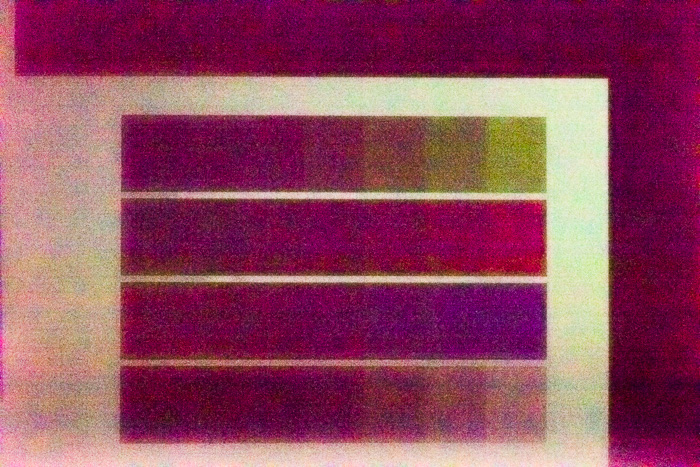
OK, that LF noise is pretty ugly.
But look at how dim we had to make the image to get it to stand out! No wonder I haven’t been bothered by it in the past.
By the way. I didn’t show you any of the images before the big Lightroom Exposure moves because they look black, black, black.
My copy of D810 showed a strange read noise pattern at the top of the image, at ISO 180 or less, especially at ISO 64 and ISO 100. Just shoot a dark frame, 1/10s at ISO 64, dial up exposure compensation for 6EV or more, then there will be some color strips appear only on the very top part of the image. Can you also notice this effect? I suspect this is a firmware issue since the pattern is always there even when shooting dx crop.
I’ve never seen that.