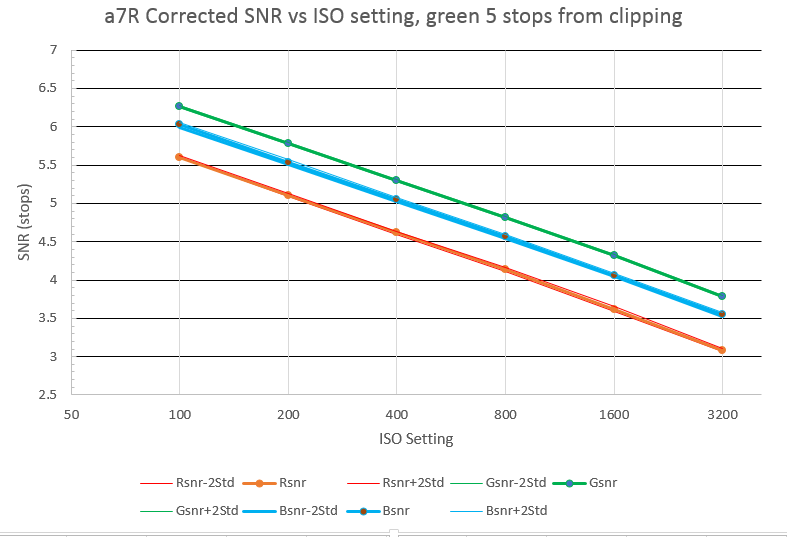
There is an odd discrepancy between the SNR data for he D800E and the a7R. Here’s the low-midtone SNR vs ISO setting for the a7R, from a few posts back:
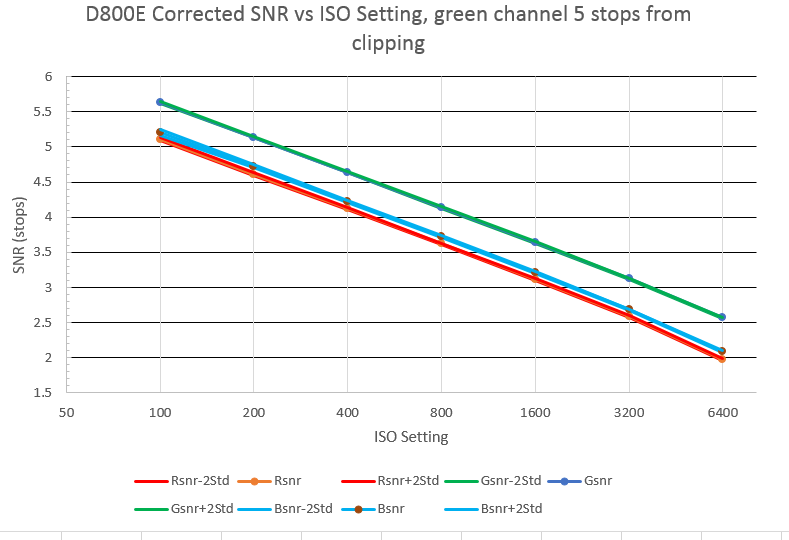
Here’s the same graph for the D800E:
Notice that the D800 SNR’s are a little over a half a stop worse than the a7R ones? What’s up with that? The chips are supposed to be very similar — some even say they’re the same — so they should yield close-to-identical results.
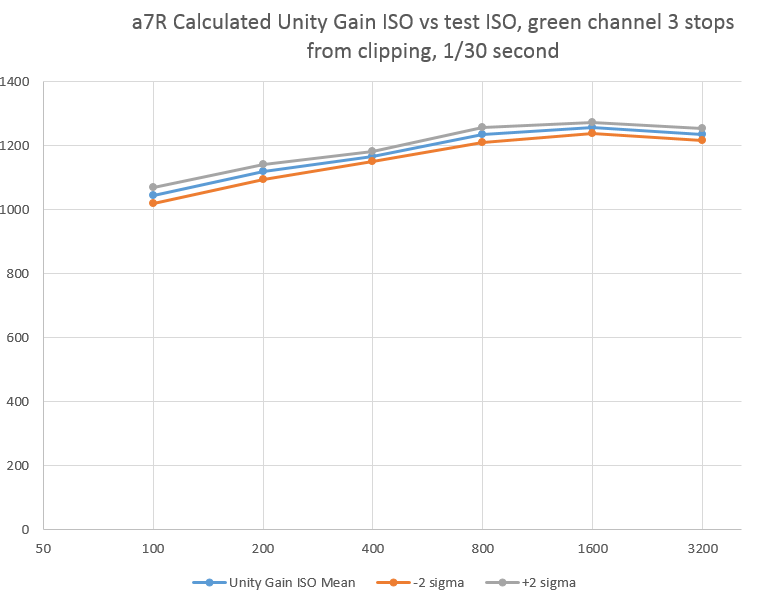
This discrepancy was driven home for me when I tried to compute the unity gain ISO for the a7R, using this methodology, and got this graph:
A unity gain ISO for this sensor of 1000 to 1200 is not reasonable. The D800 has a unity-gain ISO of about 320. This means that the full-well capacity is more then 180,000 electrons, half again as much as the D4, which has much larger sensels. That can’t be right.
I think that there’s some signal processing taking place in the a7R before the raw files are written than narrow the standard deviation of the test images, and make the camera look like it has a better SNR than it really does.
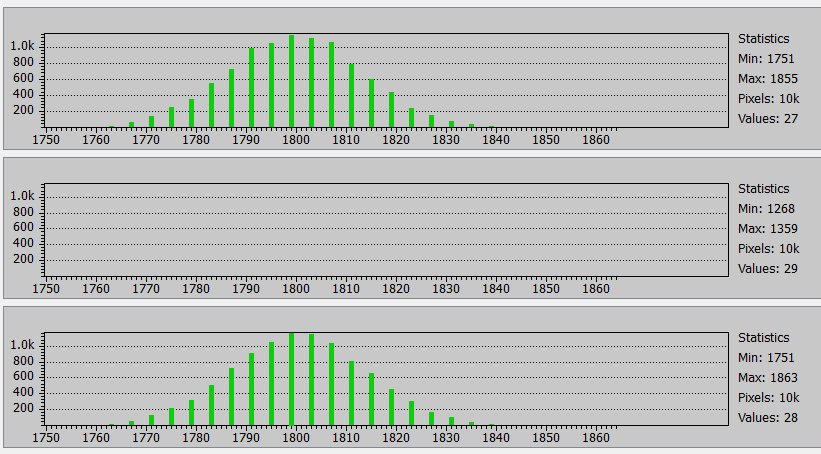
Is we look at the histograms of the green channels of a 200×200 pixel section of a raw file exposed about 3 stops down from full scale, we see curves that look Gaussian, although they are missing three-quarters of the buckets because of Sony’s tone compression algorithm.
The red channel of the same exposure has the right shape, but is only missing half the buckets because the level is lower:
At this point, I have no explanation for what’s going on here.


Hi Jim,
As a new A7r owner (I guess that’s the only kind) I’m reading your posts with great interest. I’m curious as to your thoughts as to whether the lossy compression that Sony apparently uses with it’s A7r files negatively affects image quality versus the D800e files.
Jeff Kott
San Francisco
[Added later] See http://blog.kasson.com/?p=4823
Have you seen the results on
http://alextutubalin.livejournal.com/299179.html
? Alexei took a “stock” photo (D800 @200ISO, see the first link), and measured S and N (G2avg and σ) on the gray samples (lighter gray images on darker-gray frames). The results are in the first text-mode table.
Summary: S/N² is far from being constant, and varies about 2 times. Since the test is not done in a controlled environment (so there might have been some noise on the subject?) it is not conclusive; but if the noise in different levels of gray is indeed different, this would explain the anomalies you can see.
The higher S/N² in darker areas mean noise reduction. If so, all the readings below close-to-saturation are (much more) suspect. This may be related to what you see on A7r. Any comment?