• site home
  • blog home
  • galleries
  • contact
  • underwater
  • the bleeding edge

the last word

Photography meets digital computer technology. Photography wins -- most of the time.

You are here: Home / The Last Word / Sony a7RII battery draw — high sample rate

Sony a7RII battery draw — high sample rate

November 1, 2016 JimK 2 Comments

This is a continuation in a series of posts on power consumption in the Sony a7RII. The more recent incarnation of the series starts here.

Earlier today I showed you Sony a7RII battery current draw under several operating modes, with the data gathered with a Keithley 2100 DMM. In this post, I’ll give you a look at a higher sampling rate, courtesy of a Tektronix 1102B oscilloscope. I limited the bandwidth to 20 MHz for the shots to come.  The calibration is a little iffy, so just look at the waveshapes; the numbers from the Keithley instrument are more accurate.

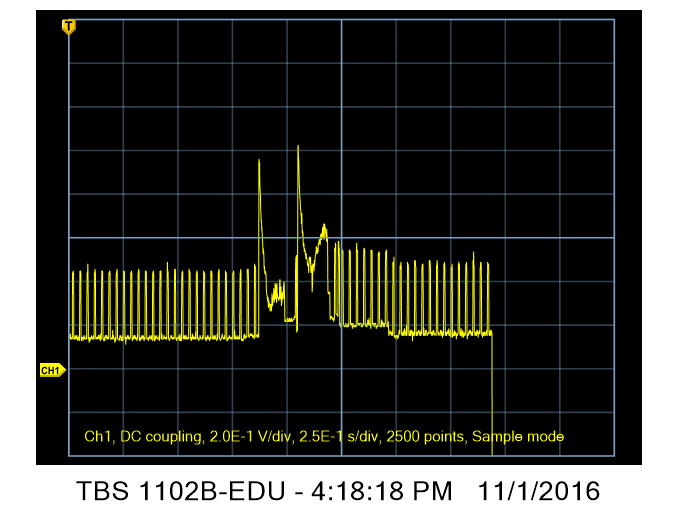
First, the idle current with the camera active.

idle-hs

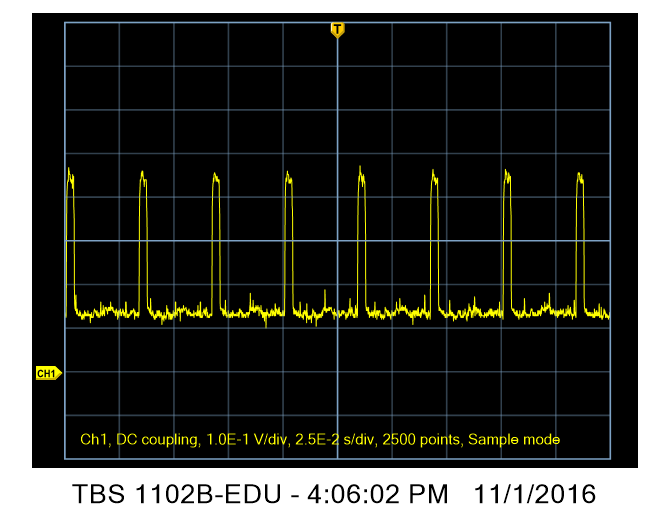
The little yellow arrow on the left is the zero-current line. The camera draws a baseline current of about 150 ma, but every so often draws about half an amp. No wonder the camera doesn’t like much resistance in series with the battery. The horizontal axis is 25 msec per division, so the camera is sipping current at a rate of about 30 sips per second. Maybe the sips have domething to do with refreshing the display.

Let’s turn on EFCS, and make an exposure of about 0,6 seconds:

efcs-on

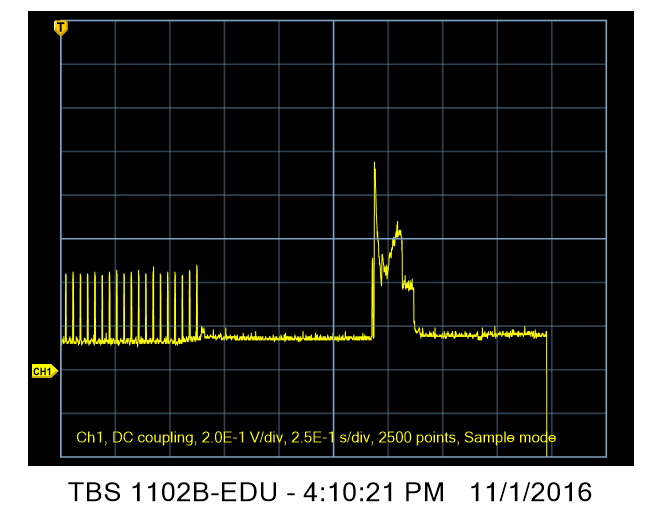
I’ve changed the time base to 250 msec/division so that we can get the whole thing on the screen. You can see that when you press the shutter, the camera stops sipping, dropping to the lower current level before and during the exposure, then the current goes way up as the shutter is wound and the data is read out. The camera drops back to the low current state for a while, and then — you can’t see it here — begins sipping again.

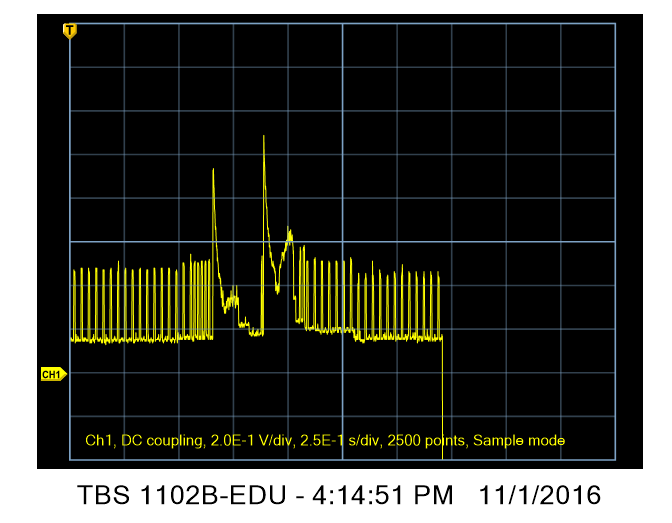
With EFCS off, it’s a different story. Here’s a one-second exposure:

efcs-off-1-sec

The camera draws a lot of current before the exposure as it winds the shutter, then drops to the low level during the exposure. There’s a big spike at the end of the exposure as the shutter is rewound and teh data is converted, read out, and written to the flash card. By looking at the difference in shapes between the pre-exposure and pot-exposure shutter winds, we can guess at how much juice it takes to read out the data and write it to the flash card. Actually, I think the writing to the card must be pretty low-drian, since it takes a long time compared to what we’re seeing here, and the camera soon goes back to sipping. 

Let’s look at a faster exposure. Here’s 1/25 second.:

efcs-off-25th

It looks like the exposure time is the lowest current state here.

At 1/1000th second:

efcsoff-1000th

Note that the whole operation hasn’t gotten much faster, since it’s a focal plane shutter and tehre’s a fair amount of overhead.

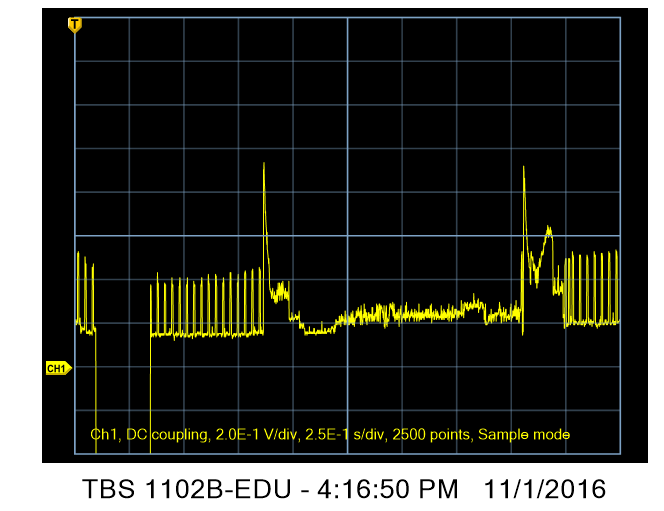
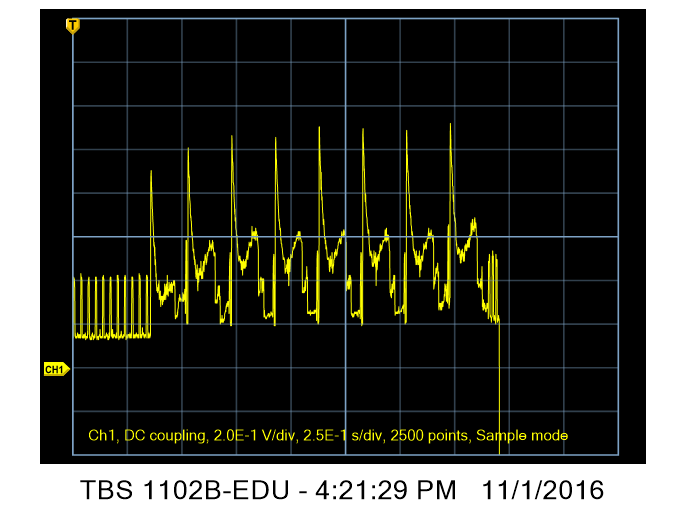
Here’s a string of 1000th second exposures in continuous mode:

string-of-1000ths


The Last Word

← Dynamic Sony a7RII battery draw Sony a7rII current draw — EVF vs LCD →

Comments

  1. Bruce Oudekerk says

    November 2, 2016 at 2:43 pm

    This is a very nice experiment, Jim.

    Unfortunately you terminated the last chart just when things were getting interesting for me. The delta of pre to post burst is presumably the writing current of buffer to SD card. On the surface there seems to be two sipping levels…which are probably while it’s writing and after writing. We should be able to see this drop succinctly and at a different point after various numbered image bursts. The timing and duration of that dip would be instructive I think.

    That distinctive and signature post-exposure curve is (I presume) the in-camera processing of that 42MP data. I doubt processing-wise Jpeg vs RAW+Jpeg vs RAW-only will make any substantive difference to that curve given there is a bitmap in the RAW file that needs to be demosaiced anyway. However, viewing compressed vs. uncompressed RAW might be a different story and be informative as to the camera’s underpinnings. I suspect that curve’s shape and duration would be significantly different to what we are seeing in all the other plots.

    Bruce

    Reply
    • Jim says

      November 2, 2016 at 3:27 pm

      Thanks. I’ll do some more work. I now believe the sipping is the result of display refresh. See the next post; I just added two images that indicate that that is likely the case.

      Reply

Leave a Reply Cancel reply

Your email address will not be published. Required fields are marked *

May 2025
S M T W T F S
 123
45678910
11121314151617
18192021222324
25262728293031
« Apr    

Articles

  • About
    • Patents and papers about color
    • Who am I?
  • How to…
    • Backing up photographic images
    • How to change email providers
    • How to shoot slanted edge images for me
  • Lens screening testing
    • Equipment and Software
    • Examples
      • Bad and OK 200-600 at 600
      • Excellent 180-400 zoom
      • Fair 14-30mm zoom
      • Good 100-200 mm MF zoom
      • Good 100-400 zoom
      • Good 100mm lens on P1 P45+
      • Good 120mm MF lens
      • Good 18mm FF lens
      • Good 24-105 mm FF lens
      • Good 24-70 FF zoom
      • Good 35 mm FF lens
      • Good 35-70 MF lens
      • Good 60 mm lens on IQ3-100
      • Good 63 mm MF lens
      • Good 65 mm FF lens
      • Good 85 mm FF lens
      • Good and bad 25mm FF lenses
      • Good zoom at 24 mm
      • Marginal 18mm lens
      • Marginal 35mm FF lens
      • Mildly problematic 55 mm FF lens
      • OK 16-35mm zoom
      • OK 60mm lens on P1 P45+
      • OK Sony 600mm f/4
      • Pretty good 16-35 FF zoom
      • Pretty good 90mm FF lens
      • Problematic 400 mm FF lens
      • Tilted 20 mm f/1.8 FF lens
      • Tilted 30 mm MF lens
      • Tilted 50 mm FF lens
      • Two 15mm FF lenses
    • Found a problem – now what?
    • Goals for this test
    • Minimum target distances
      • MFT
      • APS-C
      • Full frame
      • Small medium format
    • Printable Siemens Star targets
    • Target size on sensor
      • MFT
      • APS-C
      • Full frame
      • Small medium format
    • Test instructions — postproduction
    • Test instructions — reading the images
    • Test instructions – capture
    • Theory of the test
    • What’s wrong with conventional lens screening?
  • Previsualization heresy
  • Privacy Policy
  • Recommended photographic web sites
  • Using in-camera histograms for ETTR
    • Acknowledgments
    • Why ETTR?
    • Normal in-camera histograms
    • Image processing for in-camera histograms
    • Making the in-camera histogram closely represent the raw histogram
    • Shortcuts to UniWB
    • Preparing for monitor-based UniWB
    • A one-step UniWB procedure
    • The math behind the one-step method
    • Iteration using Newton’s Method

Category List

Recent Comments

  • JimK on Goldilocks and the three flashes
  • DC Wedding Photographer on Goldilocks and the three flashes
  • Wedding Photographer in DC on The 16-Bit Fallacy: Why More Isn’t Always Better in Medium Format Cameras
  • JimK on Fujifilm GFX 100S II precision
  • Renjie Zhu on Fujifilm GFX 100S II precision
  • JimK on Fuji 20-35/4 landscape field curvature at 23mm vs 23/4 GF
  • Ivo de Man on Fuji 20-35/4 landscape field curvature at 23mm vs 23/4 GF
  • JimK on Fuji 20-35/4 landscape field curvature at 23mm vs 23/4 GF
  • JimK on Fuji 20-35/4 landscape field curvature at 23mm vs 23/4 GF
  • Ivo de Man on Fuji 20-35/4 landscape field curvature at 23mm vs 23/4 GF

Archives

Copyright © 2025 · Daily Dish Pro On Genesis Framework · WordPress · Log in

Unless otherwise noted, all images copyright Jim Kasson.