A few weeks back, I did a series of dark-field exposures with the Sony alpha 7S (a7S) at all available ISO settings. After some processing, I produced this graph:
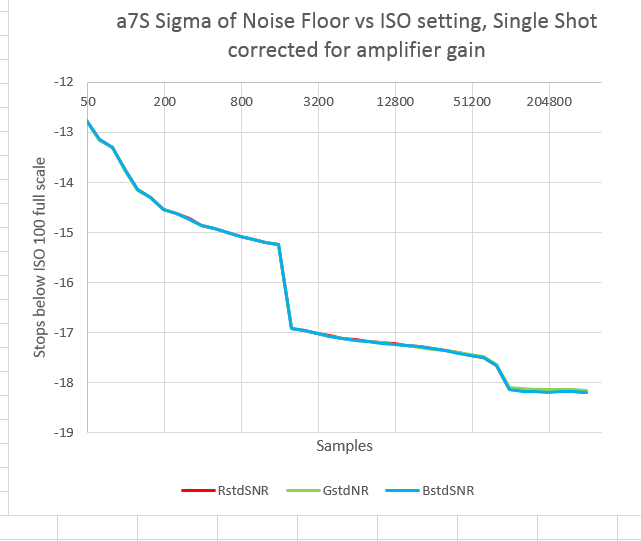
There are two places in the curve where sudden — and unexpected, at least by me — drops occur as the ISO is increased. The first one occurs as the ISO 1600 to ISO 2000 transition. I think I know what that is: the place where the a7S switches from low conversion gain to high conversion gain as described in this Aptina white paper.
The second drop, the one that occurs above ISO 50K, I had no explanation for. However, there was a thread at DPR that proved enlightening. The thread was started by a person who’s handle is DSPotographer, and, not surprisingly, he (or she, for all I know; going with the odds, I’ll use “he” here.) appears to be, as we say in patent applications, “skilled in the art” of digital signal processing.
DxOmark didn’t show the kinks. I sent DSPographer a set of my a7R dark-field files. He used a completely difference analysis protocol on them, and essentially reproduced my results. He wondered about the processing at high ISOs, and started analyzing the histograms and spectral distributions of the dark fields.
I produced the following graphs by modifying Matlab code that DSPographer wrote and sent to me. Any defects are my responsibility, and most of the mathematical sophistication comes from him.
Here’s a look at the dark field noise spectrum of the a7S at ISO 50K:
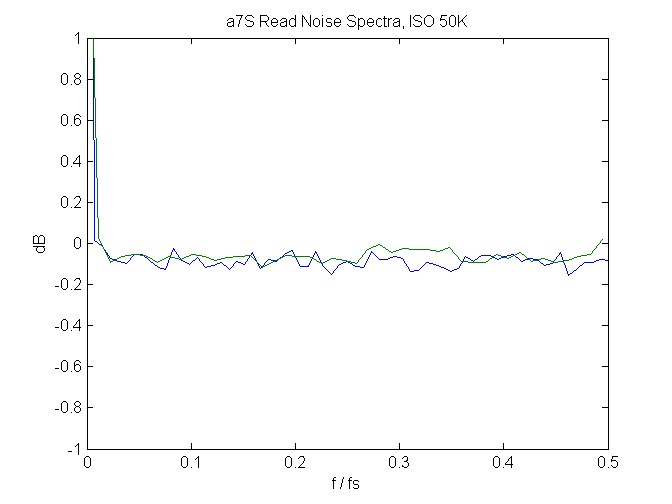 This looks like you’d expect it to look: a big spike near dc that comes from amplifier heating and other low frequency effects, and flat otherwise.
Now look at the ISO 100K plot:
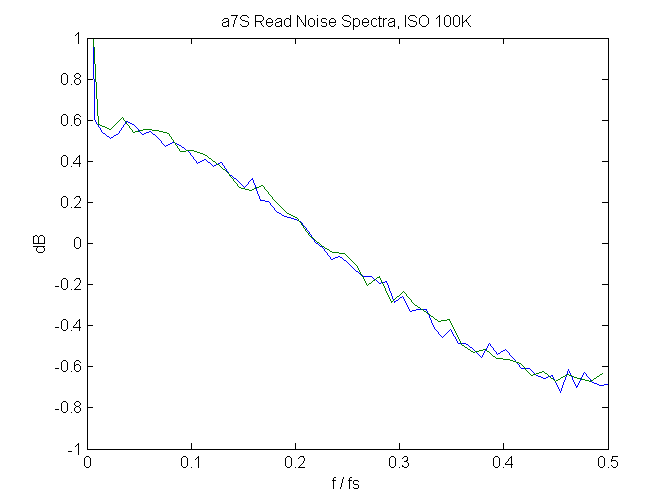
Something is rolling off the high frequencies. But what?
Using parameters that DSPotographer and I worked out together, I took the ISO 50K dark frame and applied a 2×2 median filter with a large threshold to the data.
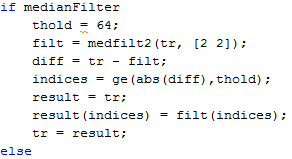
Here’s what I got:
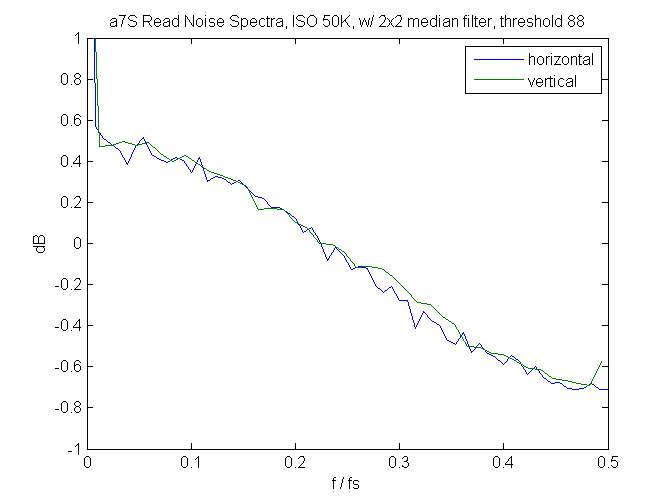
The histograms
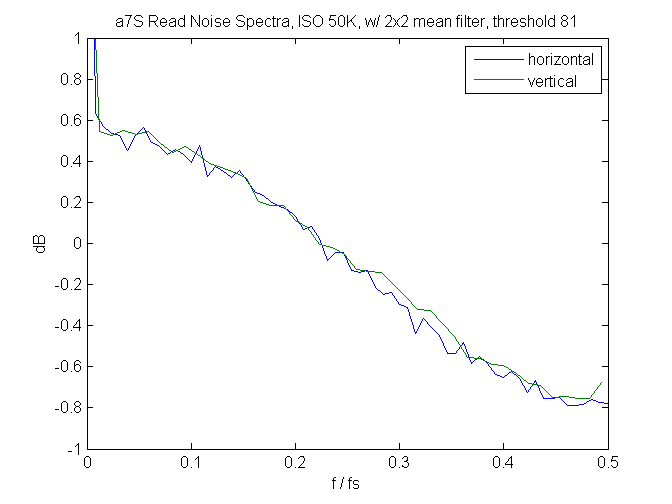
A 2×2 mean filter works pretty well, too:
DSPotographer analyzed the histograms and they make sense, too.
So, problem solved, right? Sony using some kind of thresholded spatial filter at ISOs above 50K, trading a7S resolution for noise. Probably so, but there’s something else that could be affecting this: Sony’s raw compression algorithm.
Here’s a histogram of the dark-field noise at ISO 400K:
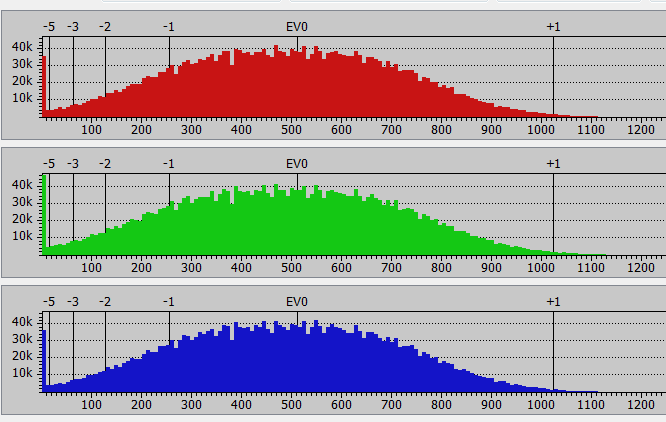
The spread is low enough that the tone compression part of the Sony raw compression algorithm won’t have much effect, but it’s big enough that the delta modulation piece of the algorithm will be active. I don’t think that’s having much effect, especially since the thresholded mean or median algorithm will keep differences out of the more aggressive parts of the delta mod coding. But I mention it for completeness.
Hi Jim,
very very interesting page! I’ve been testing A7s from a while for night sky imaging and I’ve made an ISO-gain graph that shows exactly the same step you’ve found at ISO>1600.
You state it is a change in the internal amplifier, can you give some reference? (no link to aptina)
Interestingly I’ve not seen the step at ISO>102k, maybe because I’ve turned High ISO Noise Reduction “off”?
I hope to better discuss these topics, and I too use matlab for analisys.
Are you saying you don’t want a link to Aptina? Why’s that? If that’s right, what link do you want?
The Spatial filtering above ISO 50K can’t be turned off AFAIK, nor can the similar (but different) filtering when the shutter is set to bulb.
Jim
It’s not a change in the internal amplifier per se, but a change in the conversion gain effected by changing the capacitance associated with the photodiode.
Hi Jim,
thanks for the reply! Yes, the aptina link is what I like to read! Sorry for my bad english… I was sayng that the link in your text “as described in this Aptina white paper” is missing. So please add.
You say another interesting thing about another filter applied to bulb exposures, and as an astrophotographer, I’m quite interested. What’s the best method to evidence this?
Aptina white paper: https://www.aptina.com/products/technology/DR-Pix_WhitePaper.pdf
Sony filtering of bulb exposures: http://blog.kasson.com/?p=10012
Jim
It’s a lot better than my Italian!
Jim