Well, it’s not really part 1, since I did some shutter shock testing earlier. But now I know that the camera’s vibration is no problem, I’ll give it my regular testing regime.
[Added later:
- If you’re interested in the a7 noise floor in single shot mode, look here.
- If you care that the a7 becomes a 12-bit camera in continuous drive mode, look at this.
- If you want to know about what happens when you twist the ISO knob on the a7, that’s here.
- If you want to see photographs showing the differences and similarities between turning up the ISO and pushing in post-processing, they’re here. And here.
- If you want to know the Unity Gain ISO of the a7 and see how it compares with other cameras, take a look here.
- If you want to see you the Sony/Zeiss 55mm f/1.8 FE lens on the a7 compares to the Leica 50mm f/1.4 Summilux-M ASPH on the Leica M240, it’s here.
- Can the Carl Zeiss 100mm f/2 Makro-Sonnar ZF on the a7 with the Novoflex adapter hold its own with the 90mm f/2 APO Summicron-M on the M240? The answer’s here.
- How about the Carl Zeiss 135mm f/2 APO-Sonnar ZF.2 on the a7 with the Novoflex adapter? Can it compare to the much more expensive (three times as much !) combination of the 135mm f/3.4 Leica APO-Telyt on the M240? Look here.
- If you just want the net-net on ISO adjustment on the a7, it’s here.
- Does the anti-aliasing (AA, or A-squared) filter in the A7 cost much in sharpness? Here’s the answer.
And now, on with the original review.}
The first thing I normally do when I analyze a camera is see if there are self-heating effects that I need to watch out for. If there are, it makes the testing process take a lot longer, since I have to wait between test exposures. Fortunately, these effects have not usually been material. However, I can’t count of that, so here’s how I test.
I make a series of exposures of the back of the lens cap with the aperture set to the physically smallest opening, the ISO at 3200, and the shutter speed at 1/4 second (if there’s no long-exposure noise reduction at that setting). The file format is set to raw. I use Rawdigger to analyze the files, and Excel to do the statistics.
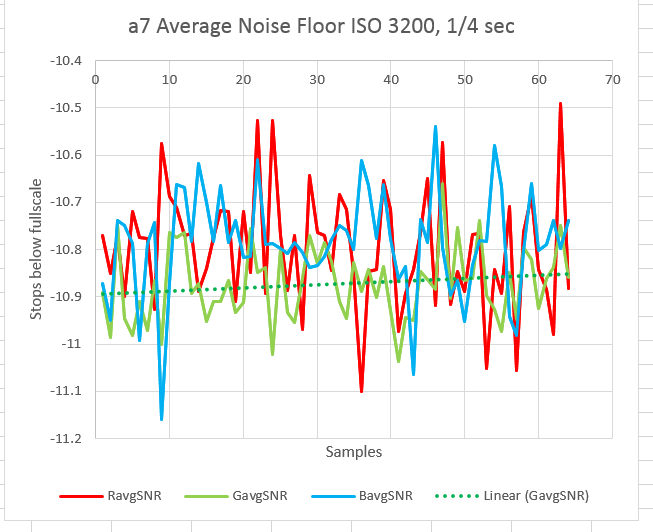
Here’s the average noise floor over 64 exposures. I’ve plotted the red and blue channels, and the average of the two green channels over a rectangle that includes the central 90% of the pixels. A least-squares fit linear trendline is included for the green-channel data:
And here’s the standard deviation of the same series:
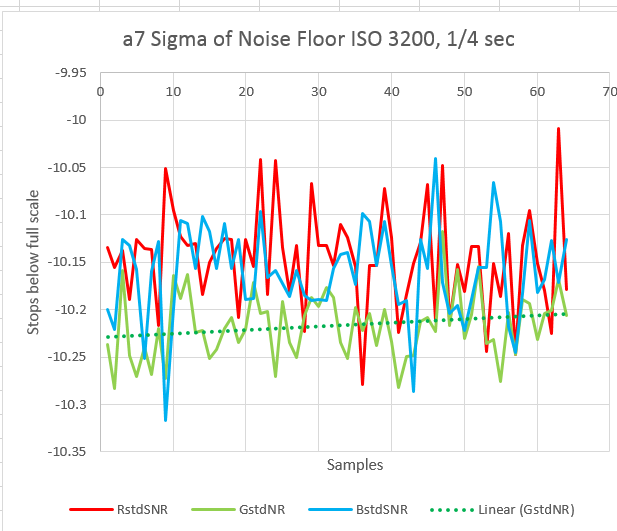
The good news is that there is little self-heating. However, when you compare these curves to the same ones for the a7R, you’ll note that the absolute performance is two stops worse. This doesn’t make sense, since the R version, by virtue of its finer pixel pitch, should show worse performance, not better. However, there were some weird things about the R results. Let’s wait for more data.
Moving on to ISO 3200 at 1/30 second, we see this for the mean:

And this for the standard deviation:

Again, not much self-heating, but the absolute results are two stops worse than the a7R.
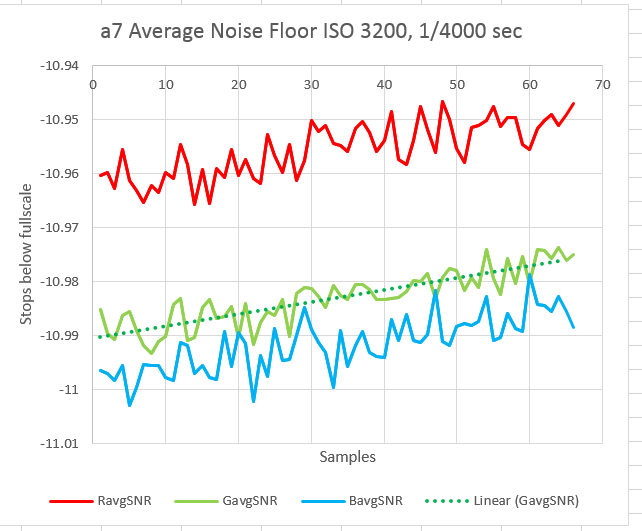
At 1/4000, the mean looks like this:
And the standard deviation:
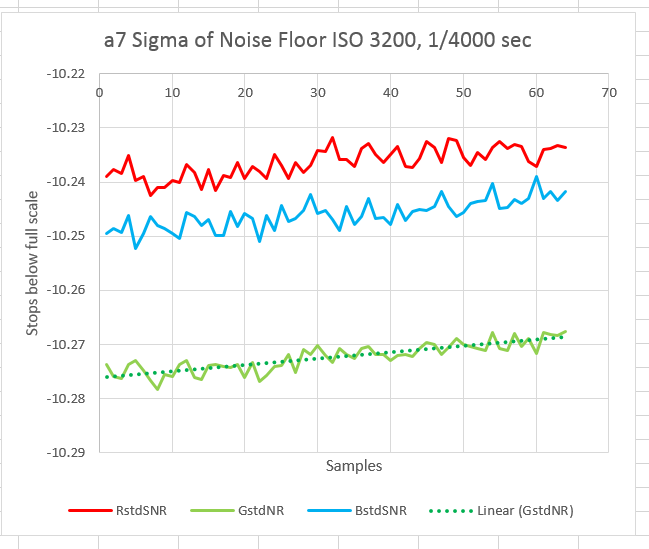
Still, not much self-heating, but the absolute results are two stops worse than the a7R.
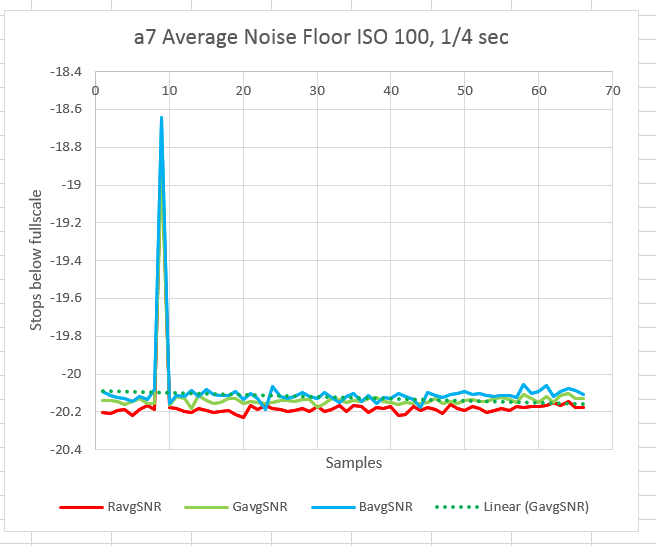
At ISO 100 and 1/4, the mean looks like this:
And the standard deviation:
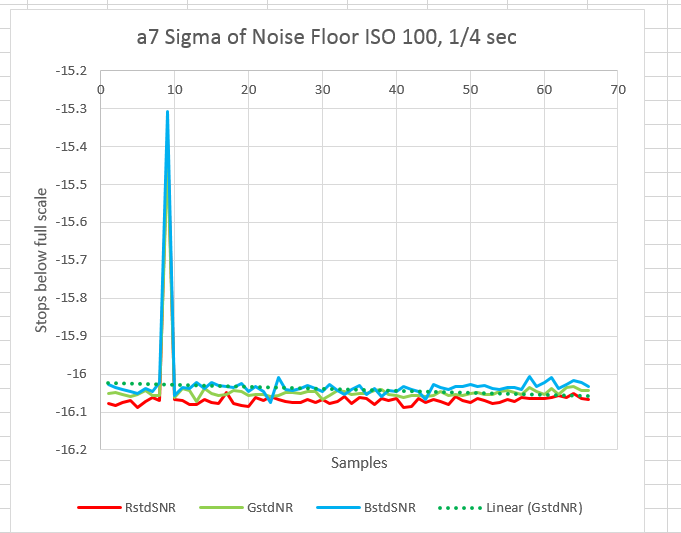
There’s an outlier. That happens sometimes. Still, not much self-heating, but – surprise — the absolute results are two stops worse than the a7R.
Looking at the histogram of the noise floor at ISO 3200 at 1/30th, we see three quarters of the buckets empty (note that the horizontal axis is linear and the vertical axis is logarithmic):

Even at ISO 100, 3/4 of the codes are MIA:
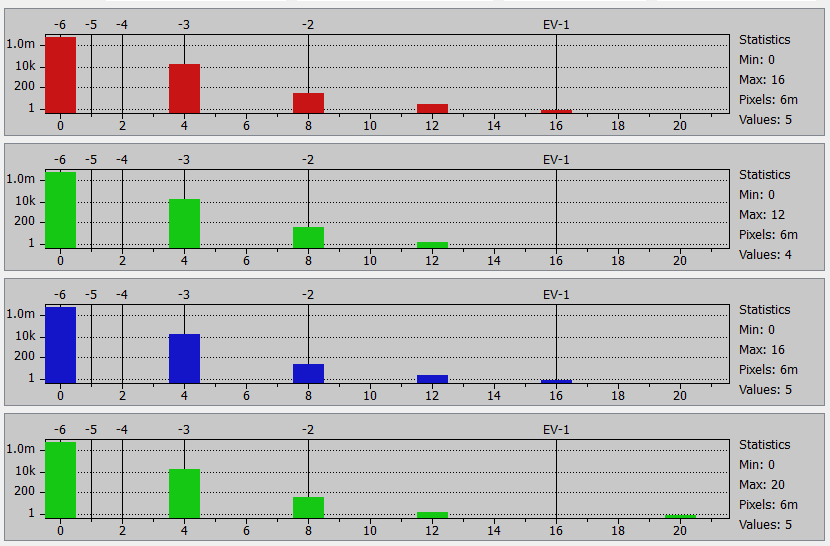
In summary, the self-heating tests indicate that there is essentially none. The noise floor is so low at ISO 100 that it indicates some processing of the raw file, although not as much as with the a7R. In the two histograms, the camera is delivering only 12 bits of resolution. Some cameras employ bit shifting to get digital gain at high ISOs, but that doesn’t appear to be the cause of the missing LSBs, since it happens at base ISO as well. It also cannot be explained by tone compression, since it happens in a region where the Sony raw tone compression is linear. Delta modulation is also not a possibility, since it happens at ISO 100 where all the values are within the 128-bit delta modulation range.
Hi, are you also going to push the A7II through your rigorous testing as the other A7 cameras here on your site? I was wondering because it was said that while the sensor is apparently the same as the old A7, a lot of reviews keep mentioning changes/improvements in image processing (whatever that means).
I’ll test the a7ii as soon as I get a version of draw that works with its raw files. If that doesn’t happen soon I’ll use the Adobe raw to dng program.
Cool, can’t wait for it. Thanks!