There’s a way to look at read noise vs ISO setting that’s different than the curves I presented in yesterday’s post. It’s a bit less intuitive, but, if you can get your head around it, it can give useful insight into how the sensor works. Rather than presenting the standard deviation of the noise in the raw file, this alternative presentation calculates what the noise must be at the input to the pre-ADC amplifier, assuming that its gain is proportional to ISO. You have to pick one ISO to be the one that’s uncorrected, and I picked ISO 100, the camera’s base ISO.
For a completely “ISO-less” camera, the corrected curve would be a flat horizontal line.
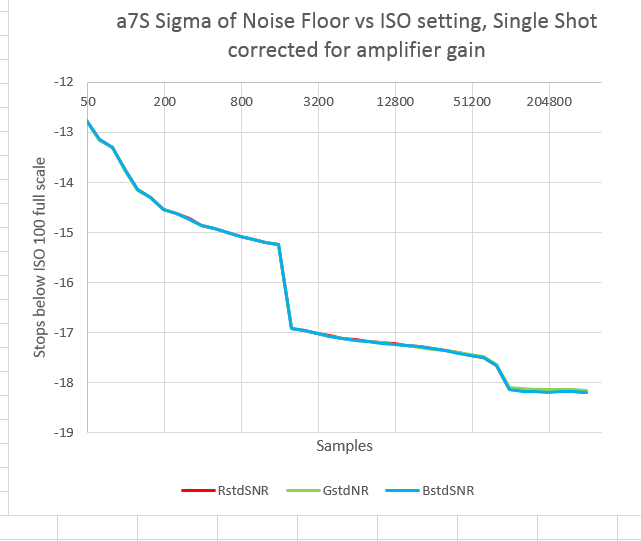
Here’s the corrected curve with the drive in single shot mode:
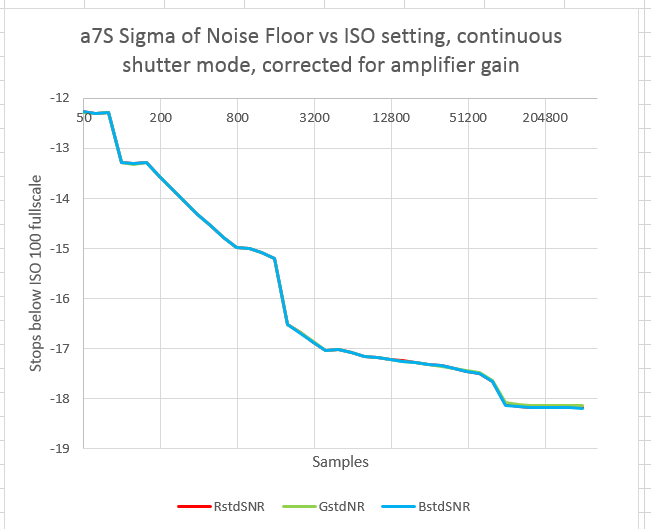
With the drive in continuous mode:
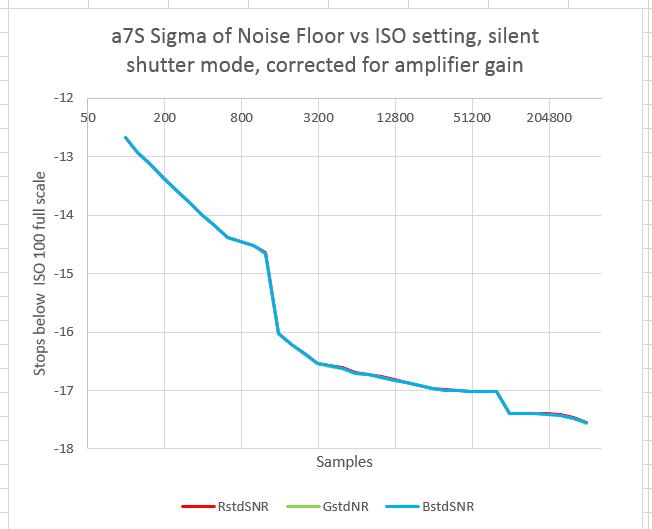
And finally, with the drive in single shot mode and silent shutter invoked:
In all three curves the pattern is the same. The read noise falls early on, giving the impression that it’s approaching an asymptote around ISO 1600, then falls precipitously again, as (I assume) the conversion gain is lowered. It then falls slowly, approaching an asymptote at ISO 100K, only to see a sudden drop again. After the second drop, the camera appears to be ISO-less with respect to read noise.
You often see curves like this with the vertical axis being electrons. To make those curves requires knowing the Unity Gain ISO. I haven’t measured that yet, so my vertical axis is stops down from full scale when the camera is set to ISO 100.
In the Aptina white paper, the example they use of the switched-conversion-gain technique changes the gain by a factor of four. That would produce a 2-stop drop at the ISO point where the gain switch occurred, which is just a little more than what we see in the graphs above.


Leave a Reply