This is one in a series of posts on the Nikon Z7. You should be able to find all the posts about that camera in the Category List on the right sidebar, below the Articles widget. There’s a drop-down menu there that you can use to get to all the posts in this series; just look for “Nikon Z6/7”.
Summary
- Bill Claff is probably right that the anomalous EDR results at ISO 125 and 160 are due to a firmware error.
- I can’t find the source of the lesser EDR issue at ISO 500.
- The camera employs comprehensive digital gain from ISO 8000 on up.
- For raw shooters, avoidance of ISO 125, 160, and 500 is probably a way to play things safe. There are no noise penalties for doing so.
- For raw shooters, there is probably little reason to use ISOs above 6400.
Details:
Yesterday I reported on some anomalous behavior in the Nikon Z7 engineering dynamic range (EDR) vs ISO setting curves. Bill Claff has suggested that this is the result of a firmware bug that affects the scaling of the raw images, and has further suggested that there are clues in the dark-field histograms. I usually look at histograms when I get a new camera, so it was easy for me to move that activity to the forefront, and the result is what I’ll show you in this post.
These are all from dark-field images of the back of the body cap, made at 1/1000 second, in single-shot shutter mode, with the electronic shutter (which gives the cleanest images). All image processing was turned off. The file format was 14-bit losslessly compressed raw.
ISO 64:
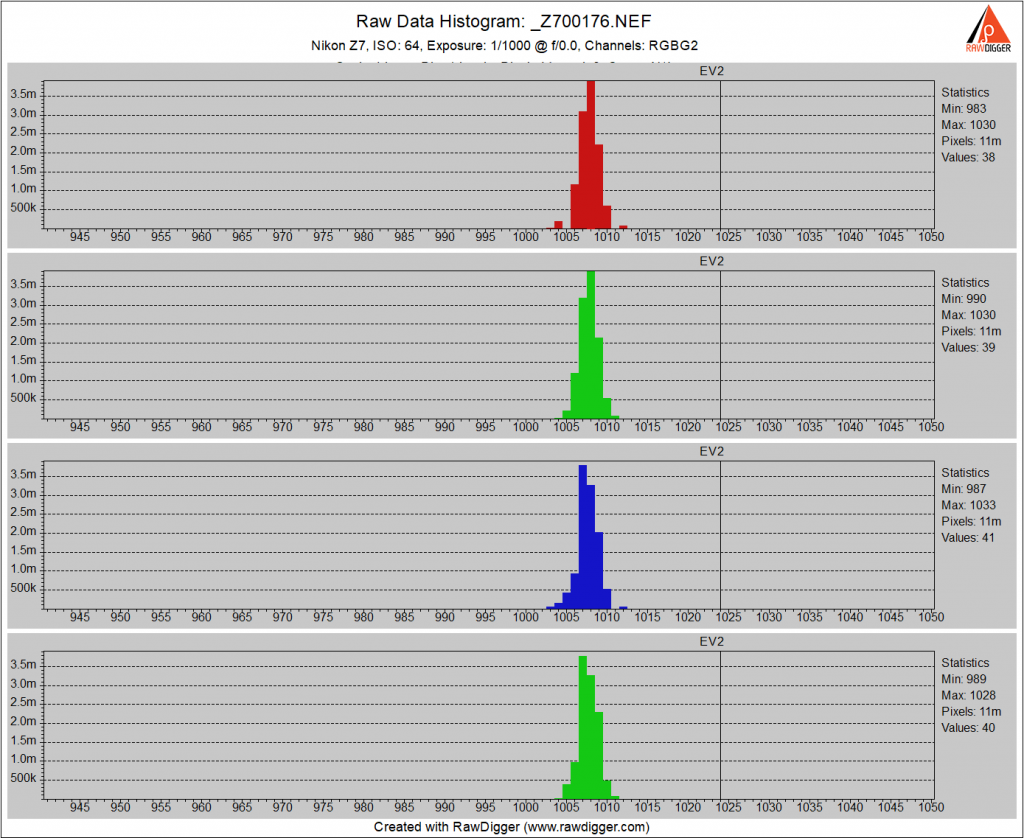
This looks normal for a Nikon, including the gaps in the blue and red channels that are caused by Nikon’s white balance prescaling.
ISO 80:
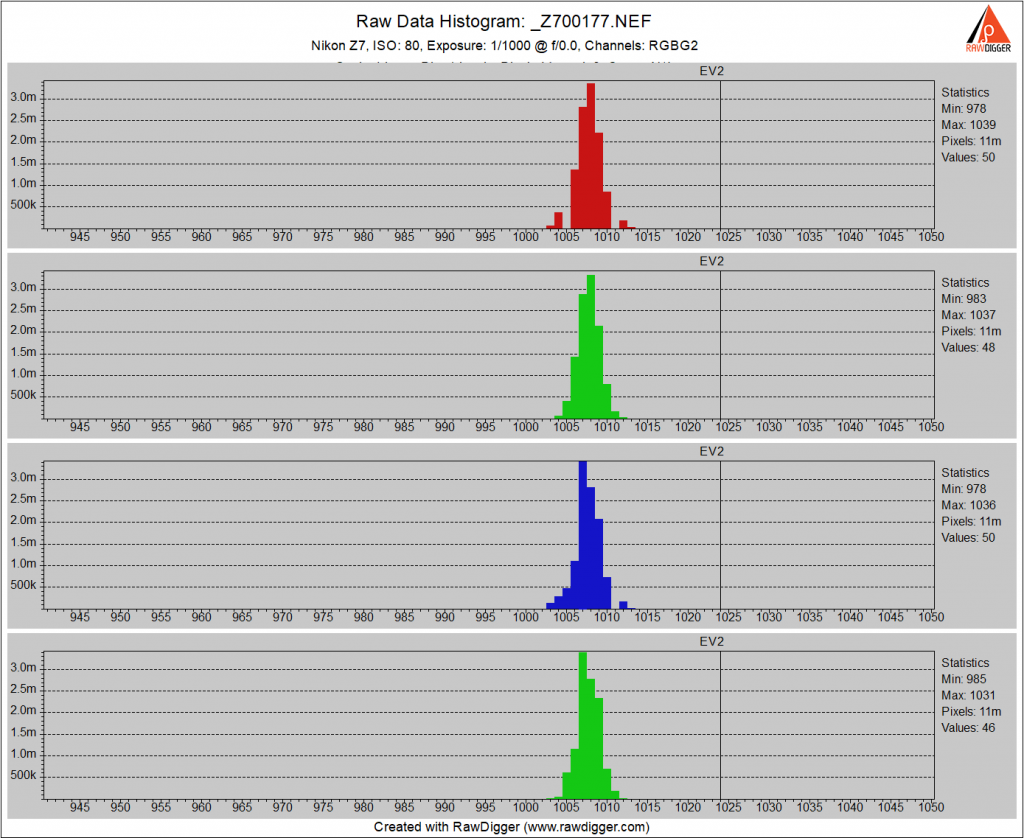
Also normal.
ISO 100:

This is the last normal one for a while.
ISO 125:

See that hole in the middle of the histogram for both green channels? That is distinctly abnormal and bears the fingerprints of digital processing.
ISO 160:
We’ve still got that hole.
ISO 200:

Now it’s gone. The G1 channel looks lumpier than it should, though.
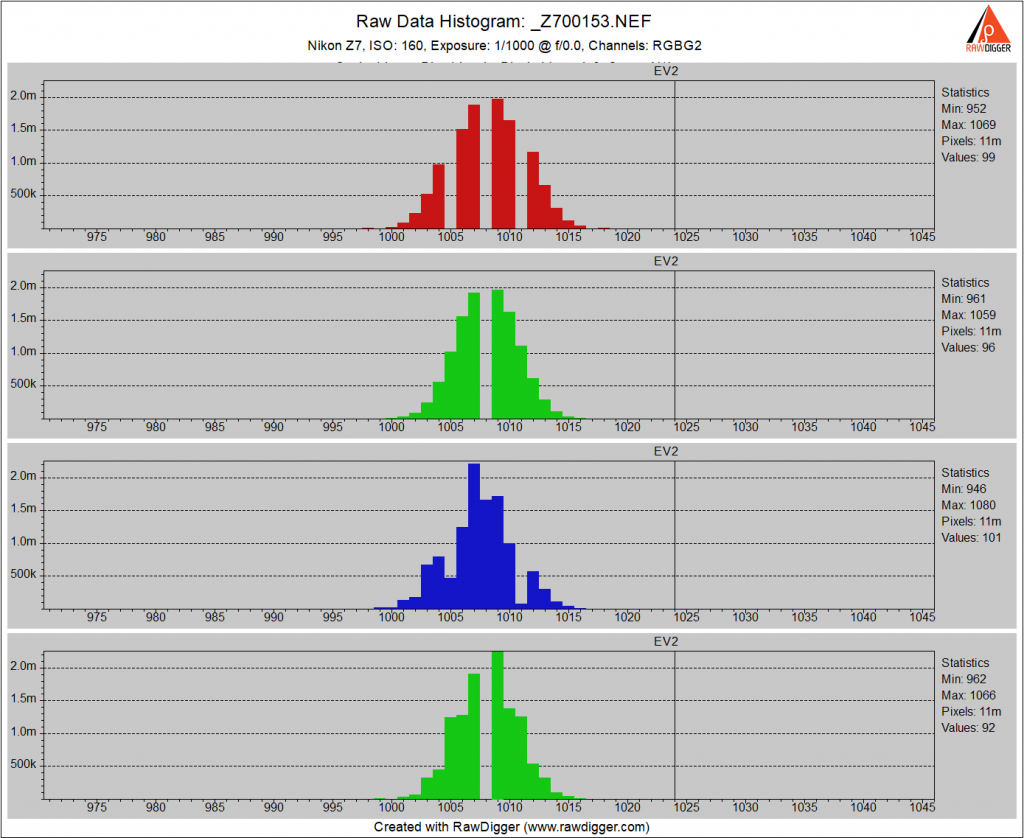
ISO 250:
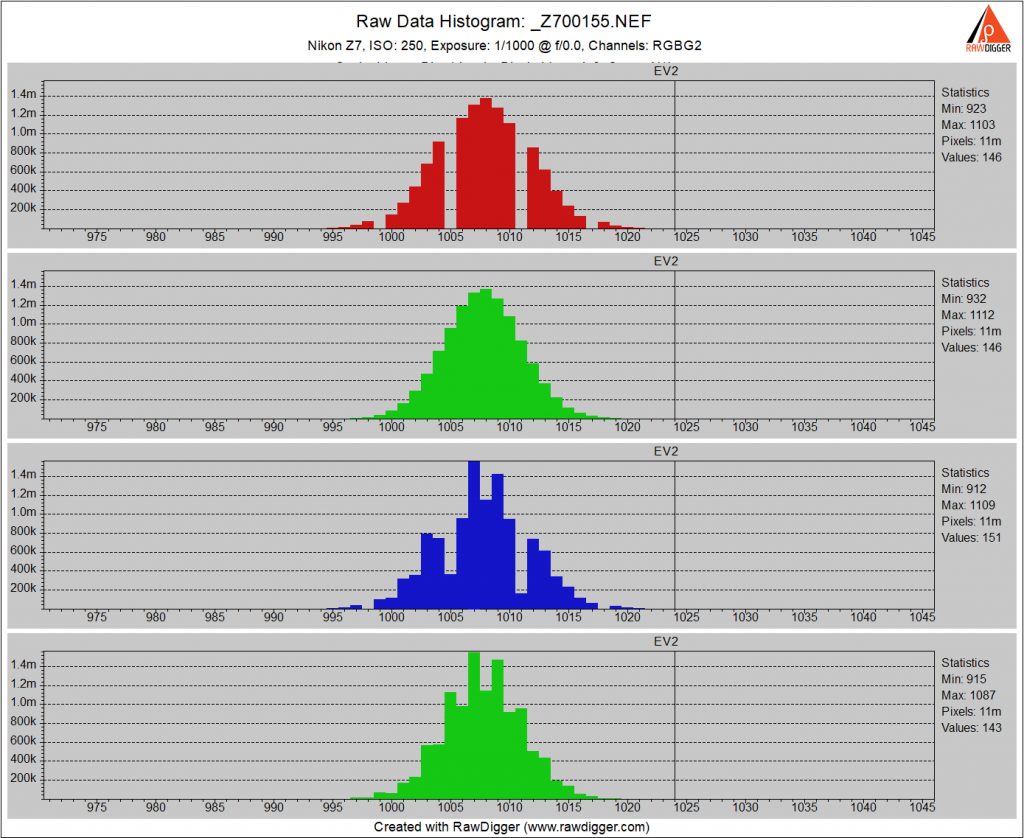
Still gone; G1 is still lumpy. The blue channel is lumpy, too. I suspect that both of those have something to do with the on-sensor PDAF in the Z7.
ISO 320:
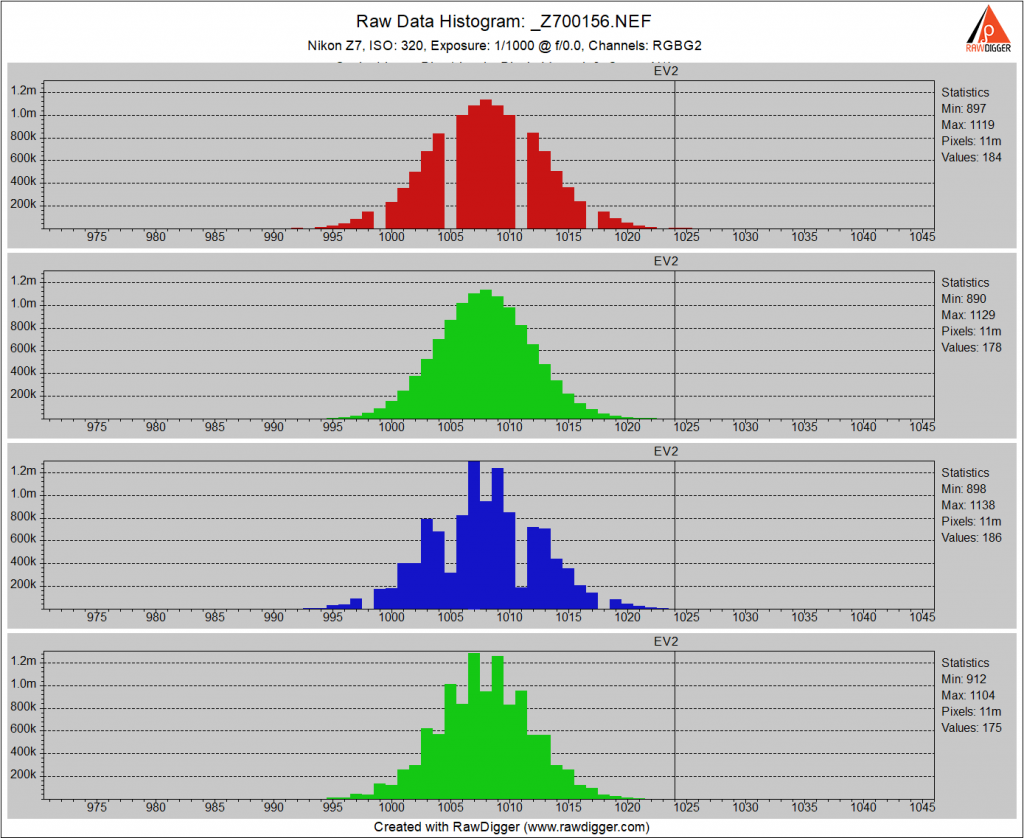
Same.
ISO 400, which is the first ISO setting with the increased conversion gain with the Z7:
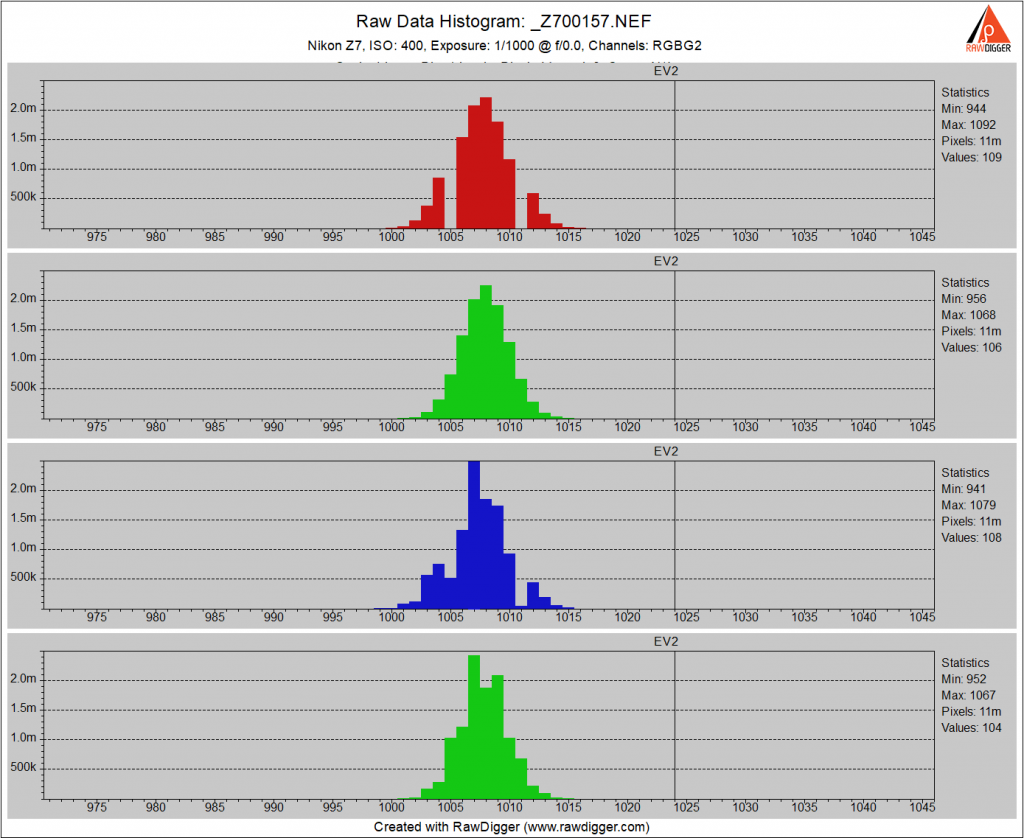
There is less noise. There is no gap, and the G1 and B channels are still lumpy.
ISO 500:
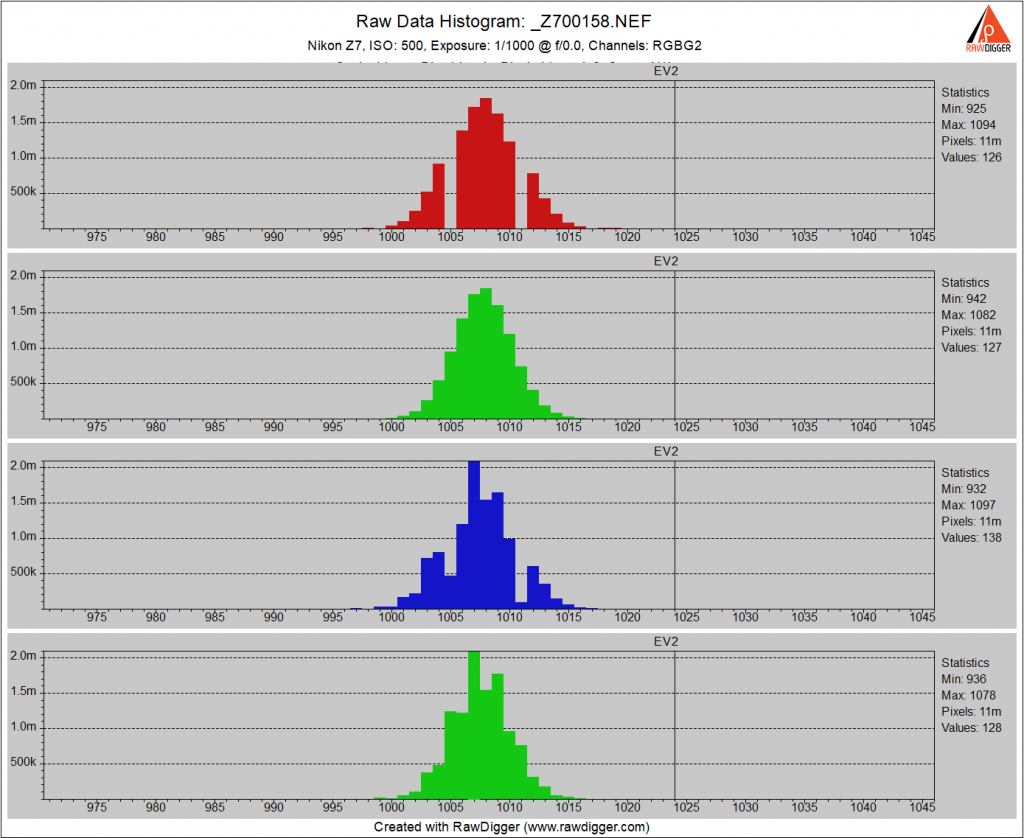
Looks similar to ISO 400. ISO 500 exhibited a bit lower EDR than it should have in yesterday’s plots, but I can’t see why from that histogram.

Same.
I’ll skip ISO 800.
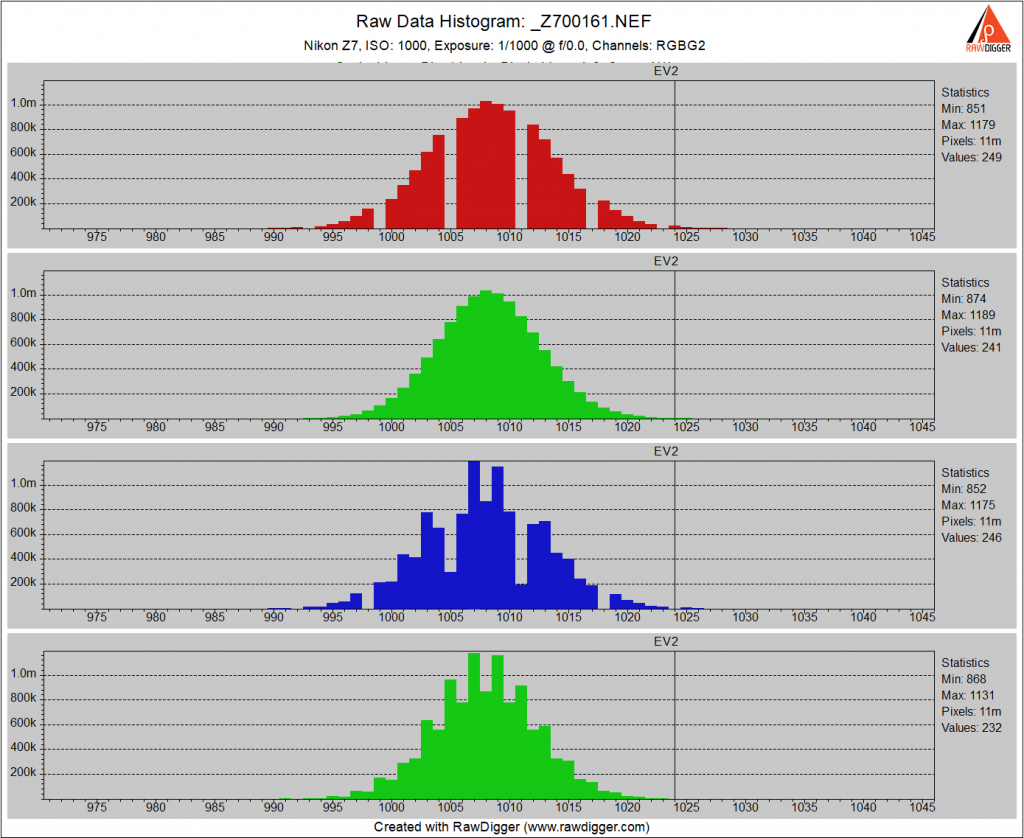
What passes for normal with this camera. Now ISO 1250:
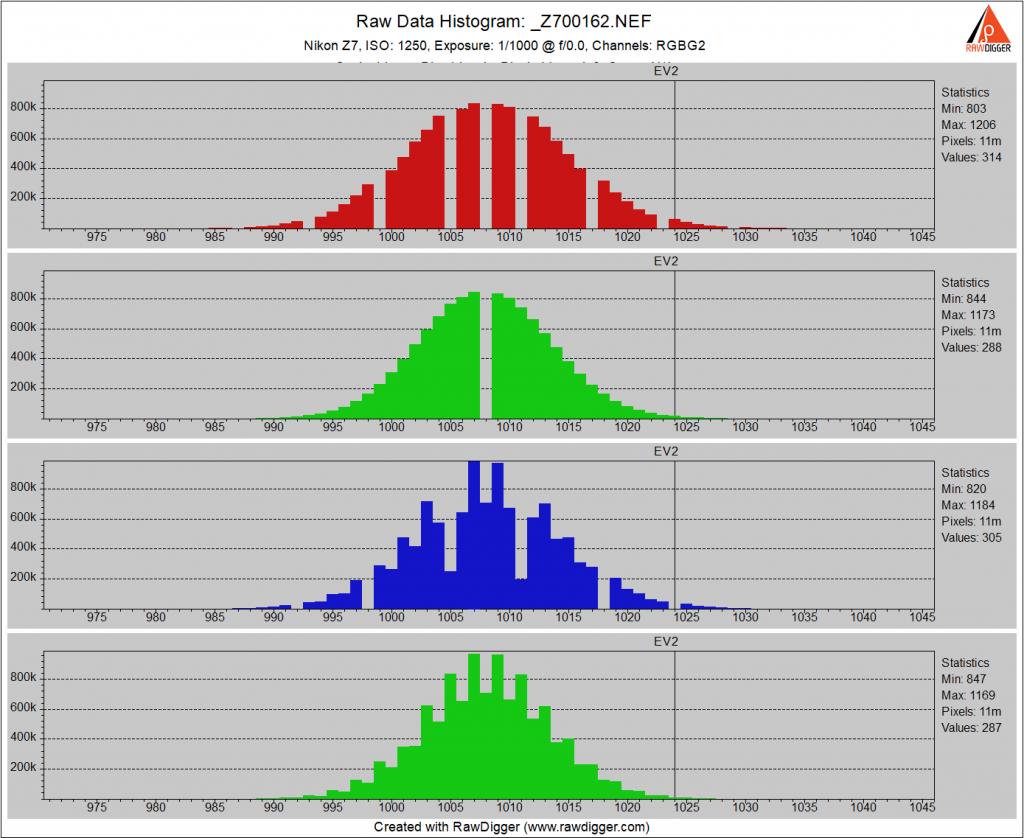
We’ve got the dropout in the middle of the G channel histo again.
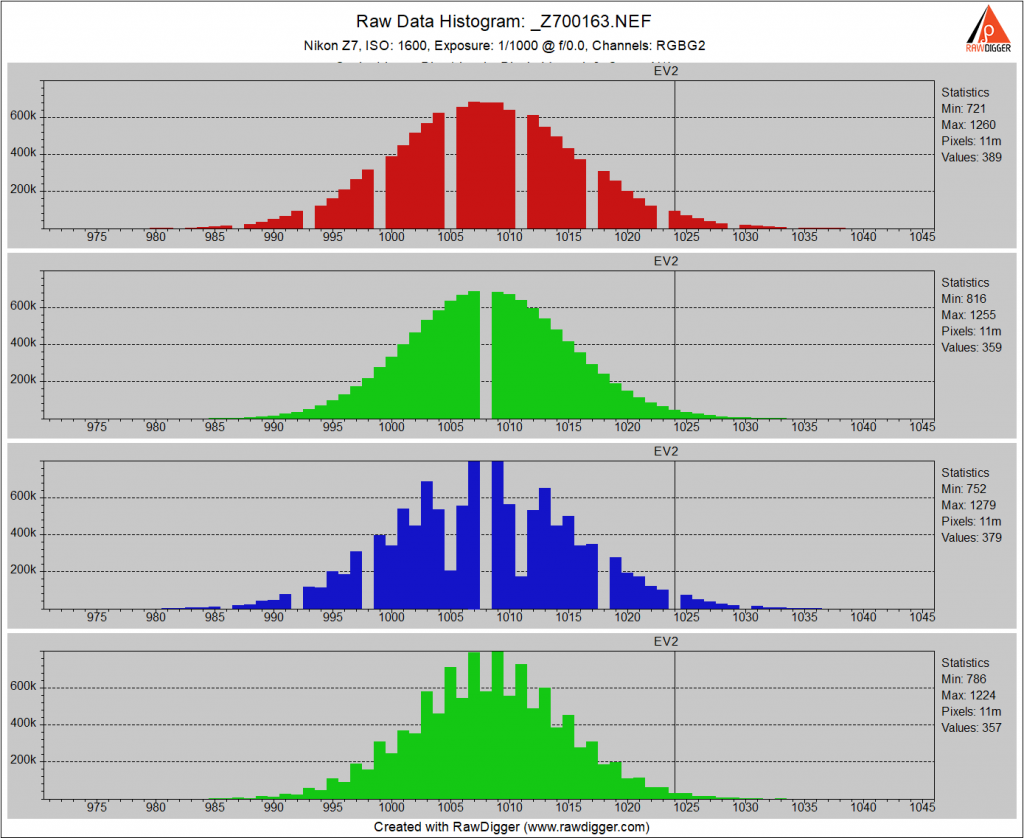
It’s still there at ISO 1600, and now there’s one in the blue channel, too.
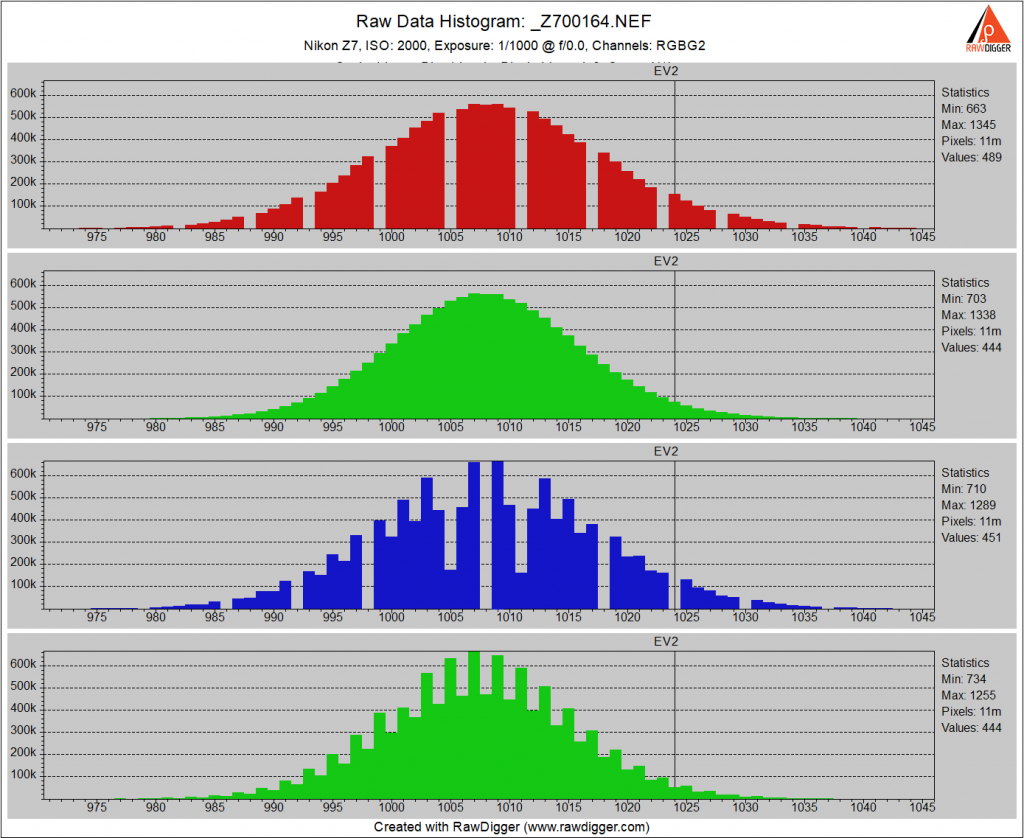
At ISO 2000, we’re back to “normal”.
I’m going to change the x-axis scale for the rest of this series.
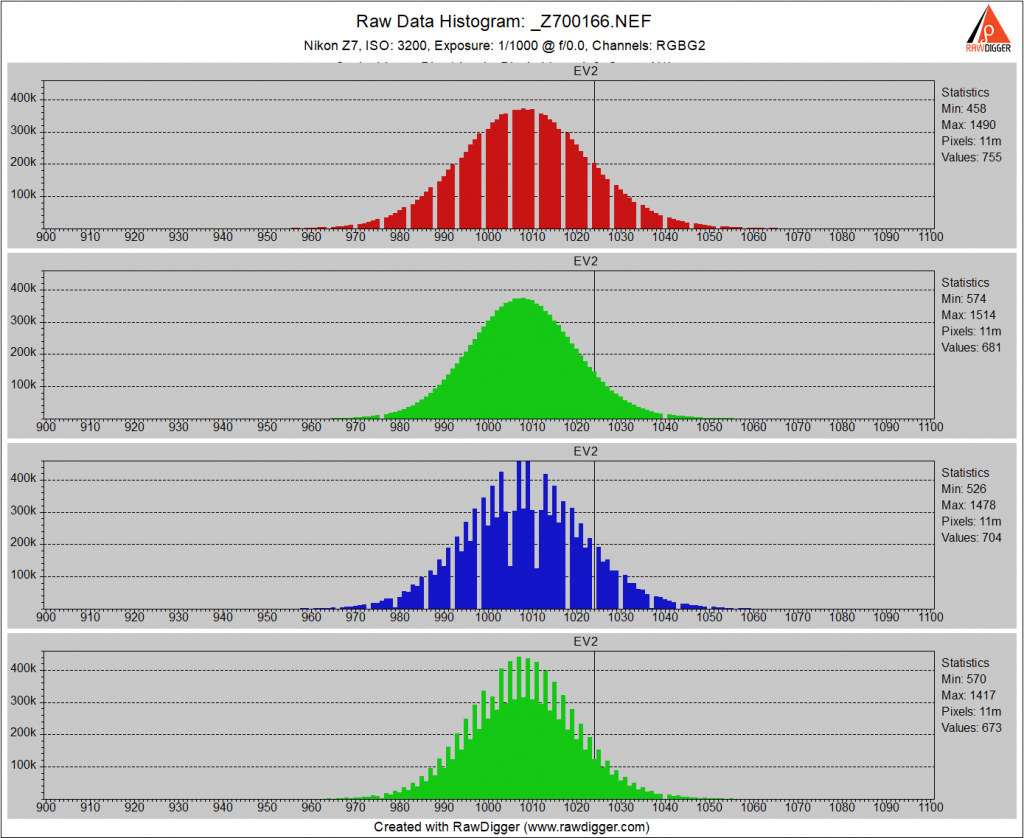
ISO 3200 has no surprises.
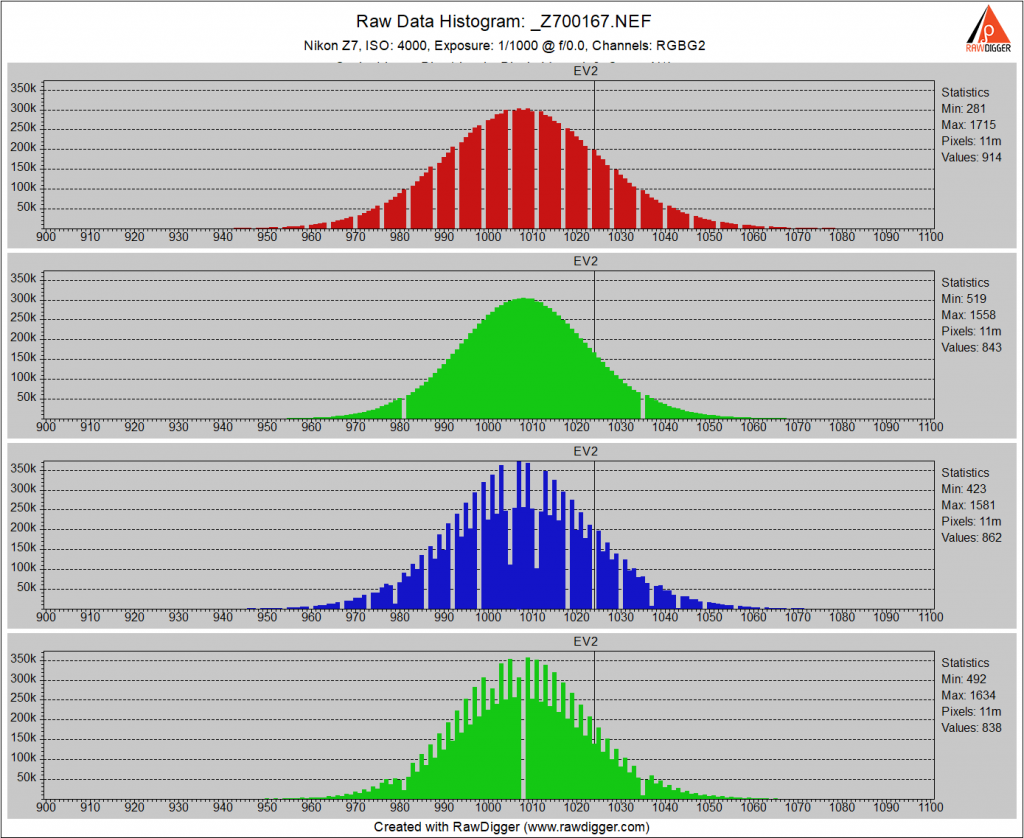
But at ISO 4000, we’ve got a G2 channel dropout in the middle of the histogram.
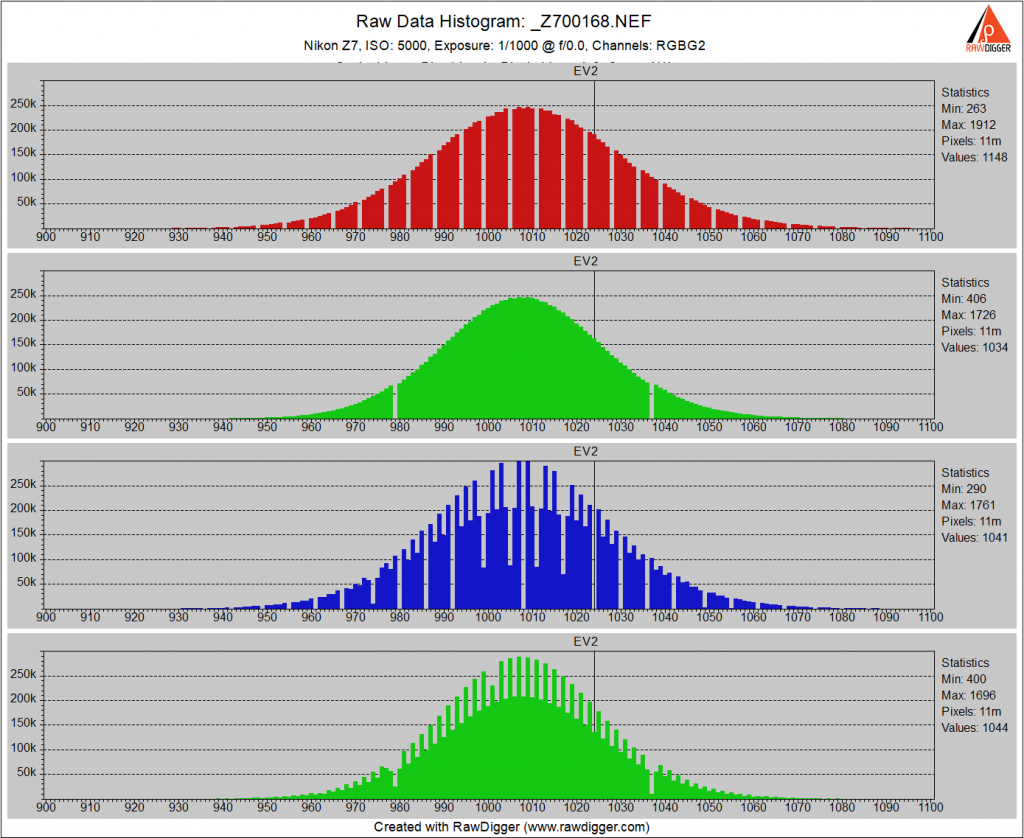
Back to normal at ISO 5000. I’ll skip 6400, which looks a lot like ISO 5000.
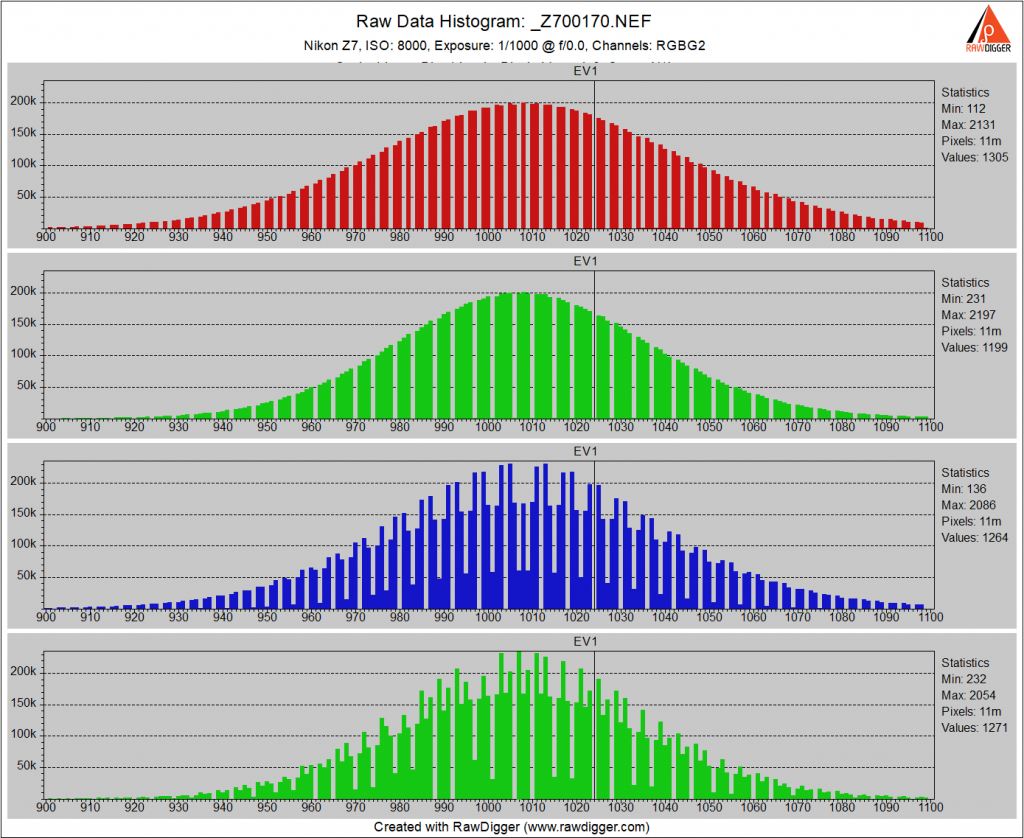
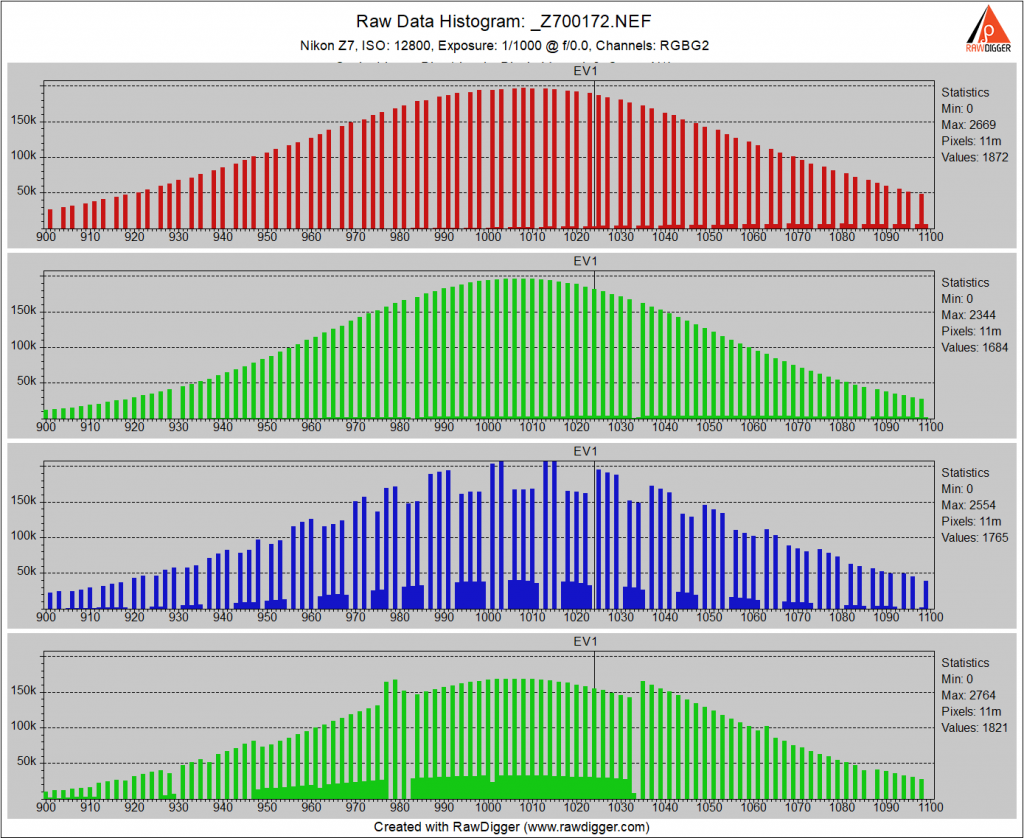
At ISo 6400, we have the first evidence of comprehensive digital gain in the form of gaps in all the channels. I disapprove.
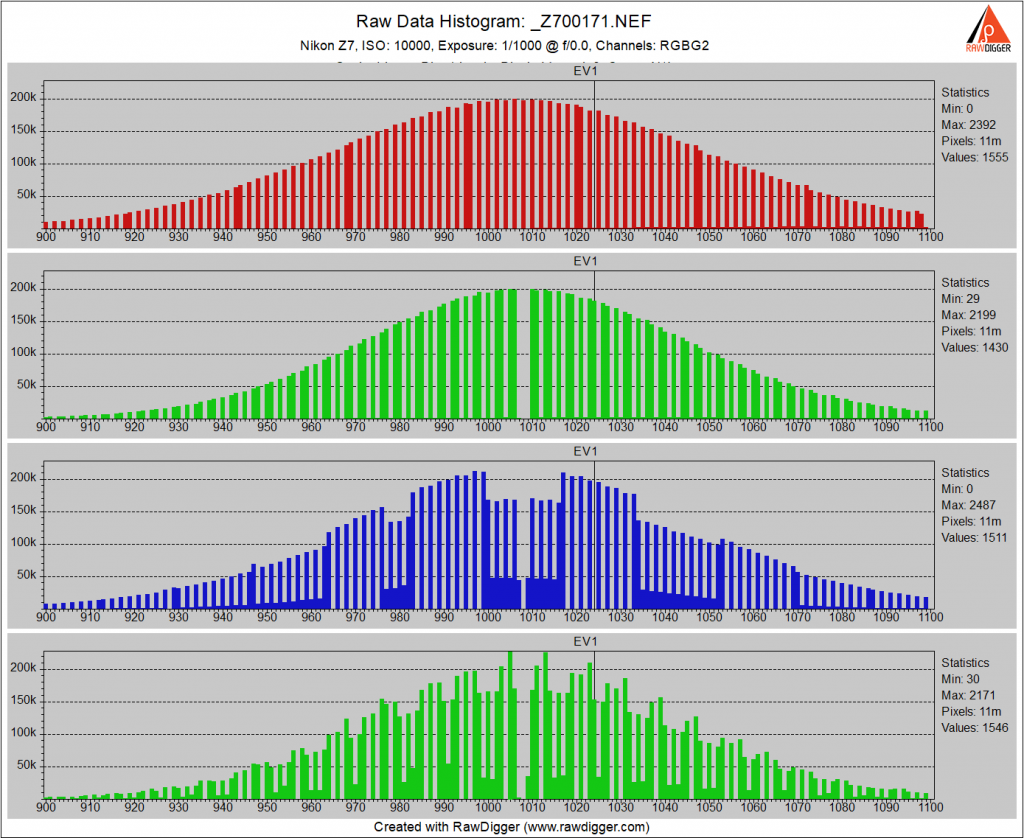
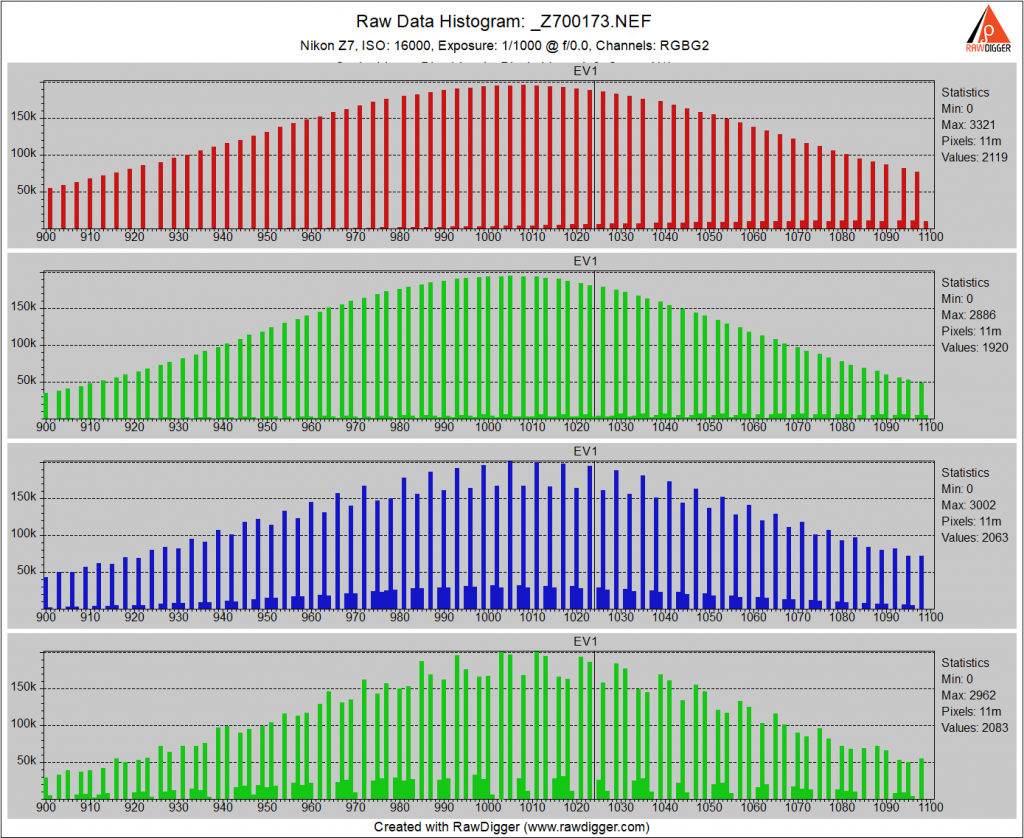
Things go from bad to worse as the ISO goes up.
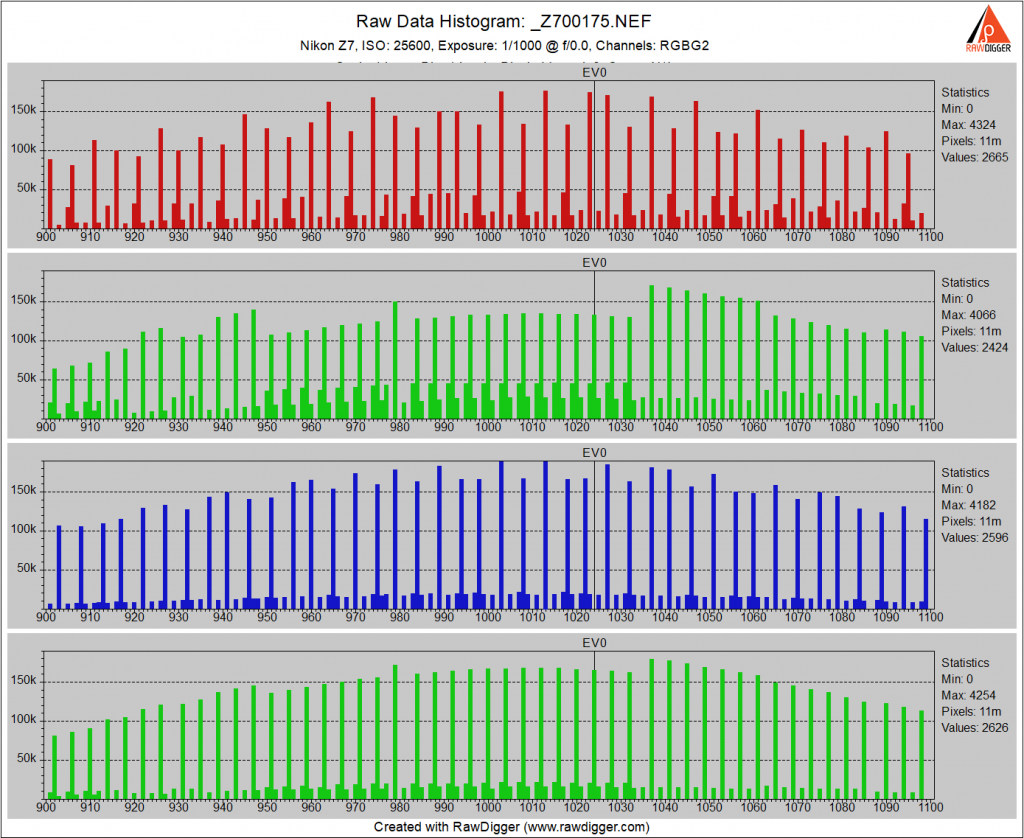
By ISO 25600, we’ve got a 12-bit system.
I don’t think any of this is going to affect real-world photography, except maybe the decreased EDR at ISO 125 and 160, but for camera geeks like me, it’s interesting.
Leave a Reply