This is one in a series of posts on the Nikon Z7. You should be able to find all the posts about that camera in the Category List on the right sidebar, below the Articles widget. There’s a drop-down menu there that you can use to get to all the posts in this series; just look for “Nikon Z6/7”.
Warning — I’m going to assume some knowledge of color science for this post.
The newer versions of Lightroom have a new Adobe camera color profile, called Adobe Color. There is also a slew of camera profiles for the Z7: Camera Standard, Camera Flat, Camera Neutral, Camera Vivid, Camera Landscape, and Camera Portrait, in addition to adobe Landscape, Adobe Portrait, Adobe Vivid, and the old reliable Adobe Standard.
Lots of choices. How do these profiles compare with each other? One way is to look at the accuracy and analyze any systematic deviations from accurate conversions. I will, however, stipulate that the objective of photographic editing is not usually to get the most accurate color; it’s to get the most pleasing color. Still, it’s often useful to start as close to accurate as possible and then tweak from there.
I started with a Z7 photograph of a Macbeth chart, made at ISO 64 with a 6ooo degree Kelvin illuminant.
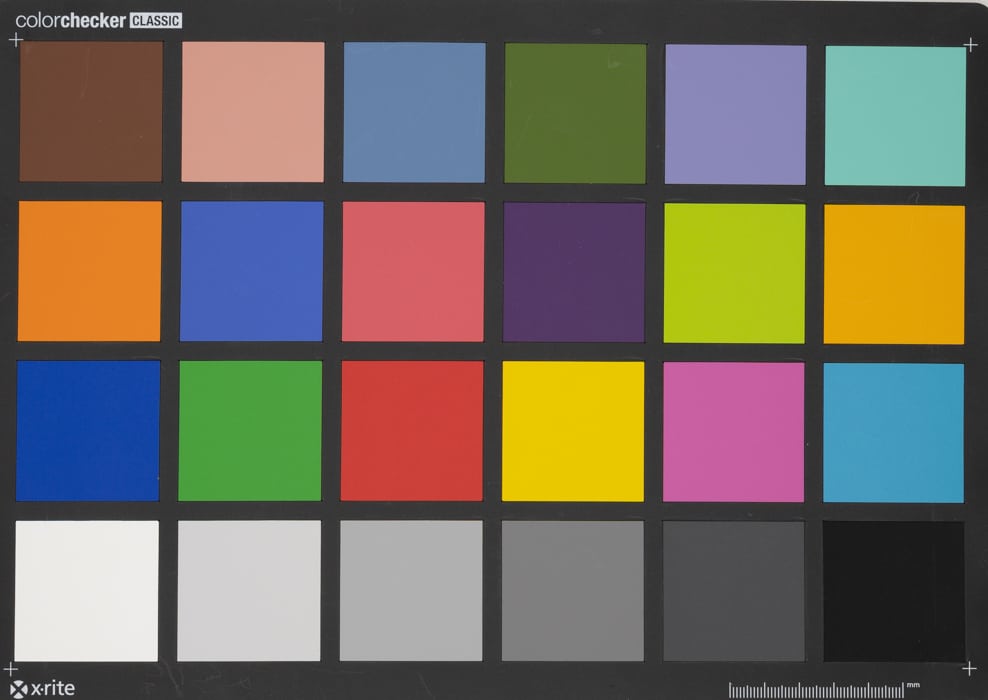
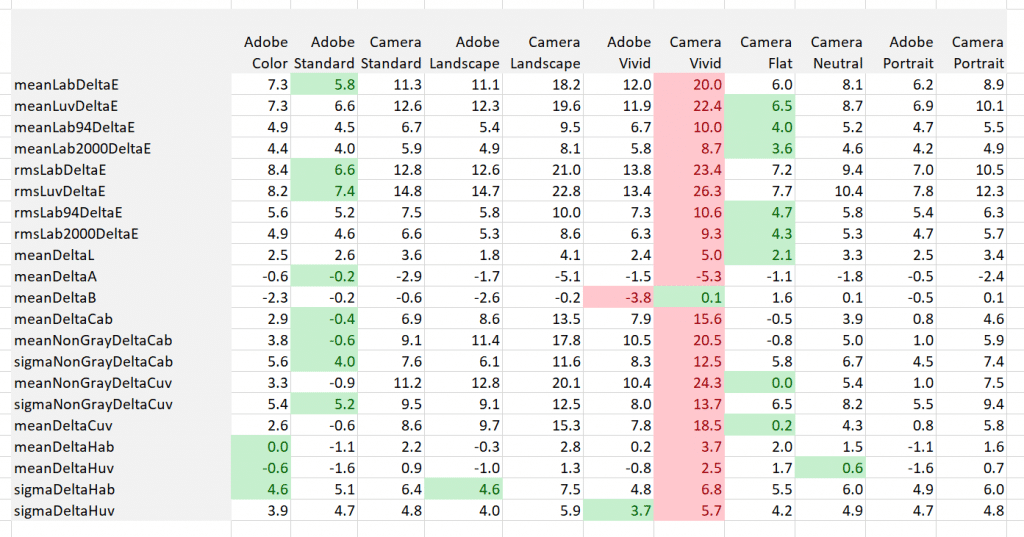
I white balanced to the third gray patch from the left in Lightroom, applied the color profiles in turn, and exported TIFF files for computer analysis with a program that I wrote. Here are the results:
Don’t panic. I know it’s complicated but I will explain it all.
The first thing to know is that a perfectly accurate color conversion would consist of a column of zeros. So, the best results are the ones with the lowest absolute values. I’ve shaded the best results in green, and the worst in red. Adobe Standard and Camera Flat are competing for the highest accuracy, and Camera Vivid is the clear winner in the race to the bottom, losing in all categories but mean delta B, because the errors in that direction happened to cancel each other.
If the measures are not obvious from the variable names that I’ve chosen, take a look at some descriptions down below. If they look pretty familiar, but you can’t quite figure out the details, here’s a crib sheet.
- Lab is CIEL*a*b*, Luv is CIEL*u*v*
- Mean is the same as average; unless otherwise specified, it applies to all 24 patches.
- Sigma is the same as standard deviation.
- RMS stands for root mean square and is a measure that weights outliers more than averaging.
- Delta means Euclidean distance for vector quantities and the arithmetic difference for scalars, except in the case of CIEL*a*b* DeltaE94 and DeltaE2000, which are more complicated color distance measures.
- Cab and Cuv are measures of chroma in their respective color spaces.
- DeltaCab and DeltaCuv are chromatic distances, which ignore luminance differences.
- Hab and Huv are hue angles, and they are converted from their natural radians to degrees to make them more approachable for some.
Here are the details of the basic measures:
Mean Delta E is the average CIELab delta E. Since Delta E can never be negative, errors in one direction don’t cancel out errors in another.
Mean Delta L is the average difference in the CIELab and CIELuv vertical (luminance) channel. Positive Delta L means that the output is brighter than it should be. Negative Delta L means that the output is darker than it should be. Thus Delta L is good for detecting systematic luminance bias.
Mean Delta A and B are the average differences in the CIELab and CIELuv a and b channels. Positive Delta A or B means that the output is redder or yellower than it should be. Negative Delta A or B means that the output is bluer or more cyan than it should be. These measures are good for detecting systematic color balance bias.
Mean Delta Cab is the average chroma error measured in Lab. A positive number means that the output colors are more saturated than they should be. A negative number means that the output colors are less saturated than they should be.
Mean Non-Gray Delta Cab is the average chroma error measured in Lab for the 18 chromatic patches. Mean Non-Gray Delta Cuv is the average chroma error measured in VIELuv for the 18 chromatic patches. A positive number means that the output colors are more saturated than they should be. A negative number means that the output colors are less saturated than they should be. The sigma metrics track the standard deviation of the 18 samples.
Mean Delta Hab is the average hue angle error measured in Lab, expressed in degrees. The gray patches are excluded from this measure since their target hue angle is undefined. A positive number means that the output colors have a hue angle higher than they should have. A negative number means that the output colors have a hue angle lower than they should have. Mean Delta Huv is the same measure in CIELuv. The sigma metrics track the standard deviation of the 18 samples.
One thing to notice is that the Adobe profiles are more accurate theu their Camera counterparts. That the vivid profiles are the worst is no shock, but the lack of accuracy of the Landscape profiles surprised me.
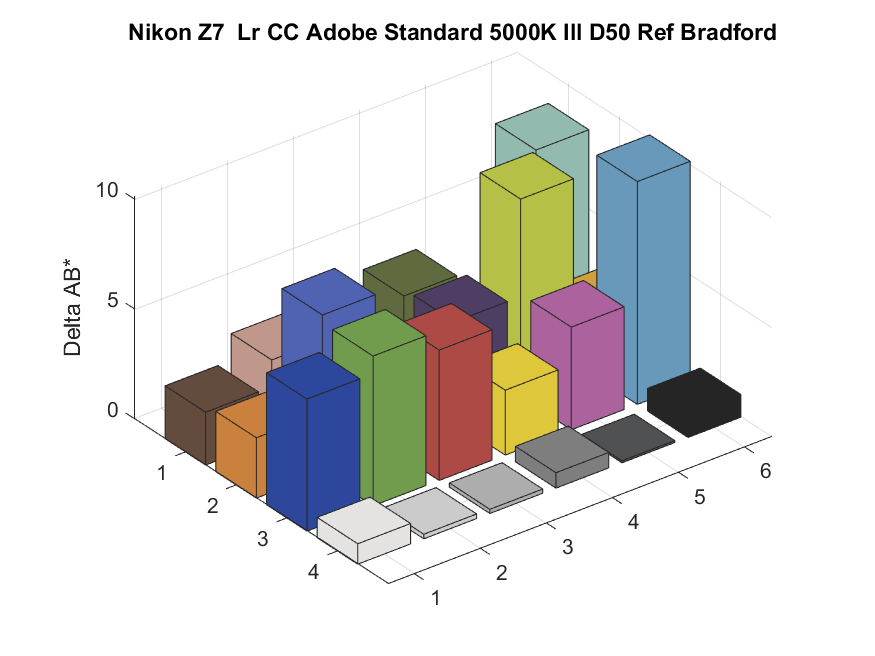
Let’s look at the chroma errors for each patch, measured in Lab, for the two best profiles.
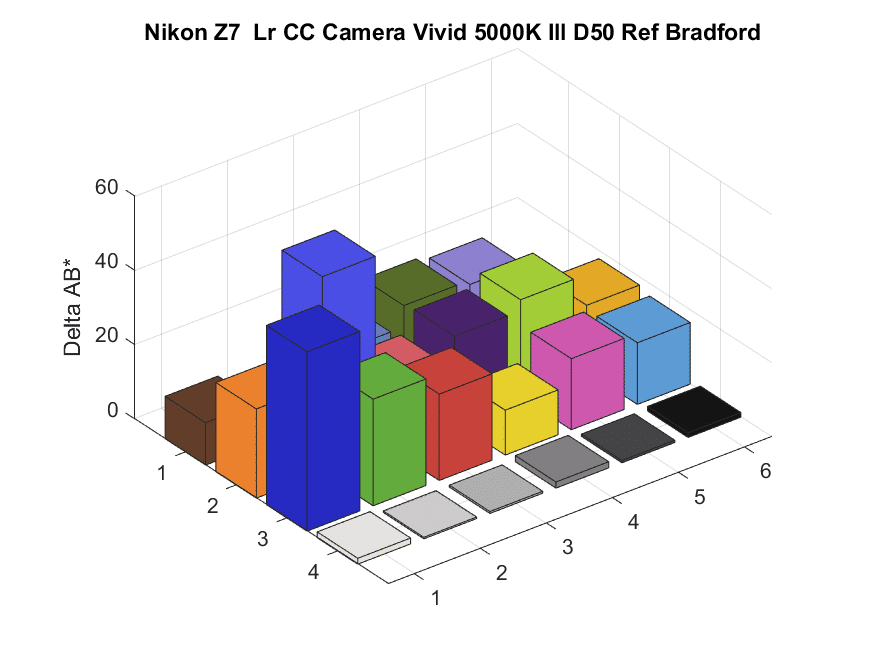
And for the worst one:
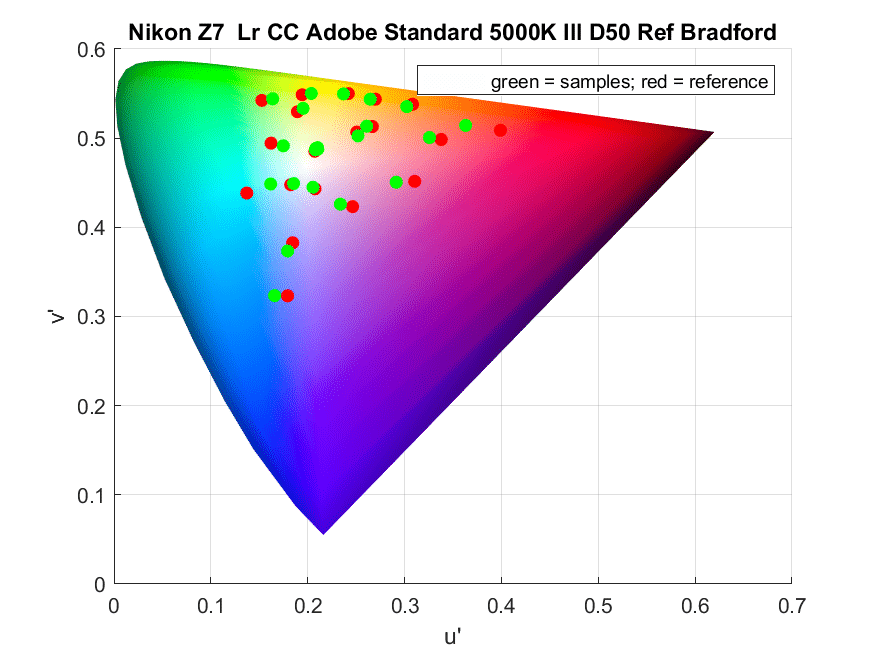
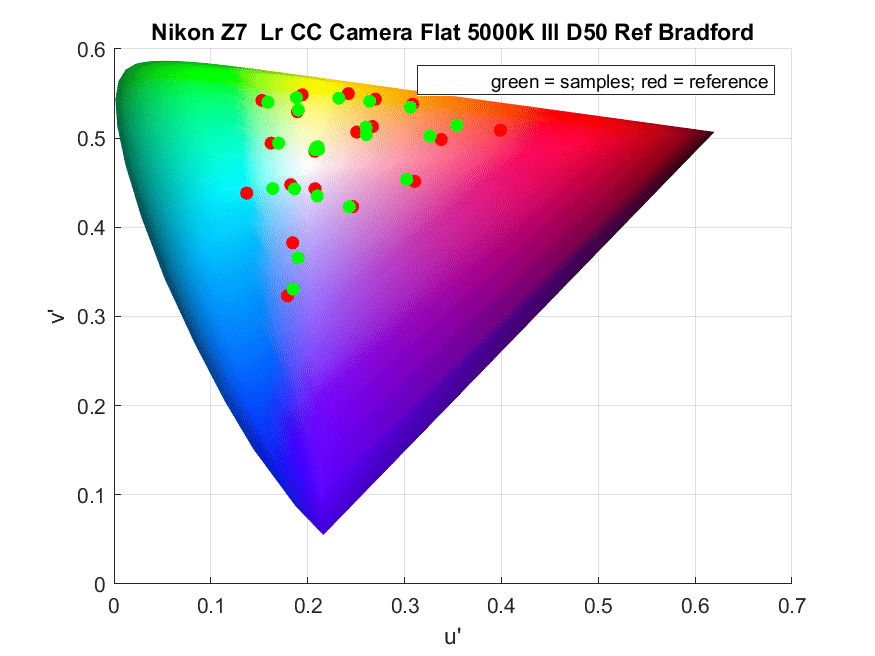
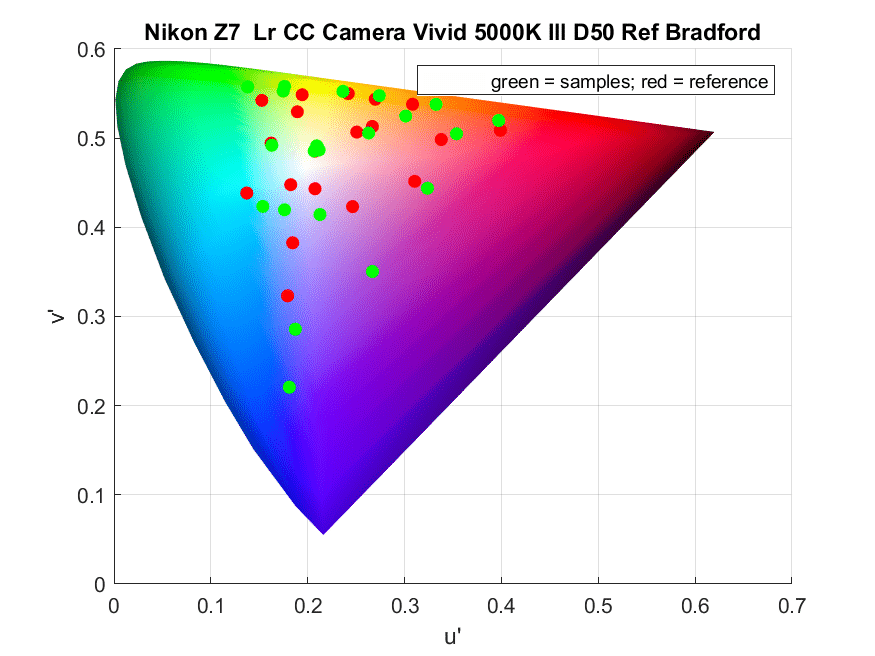
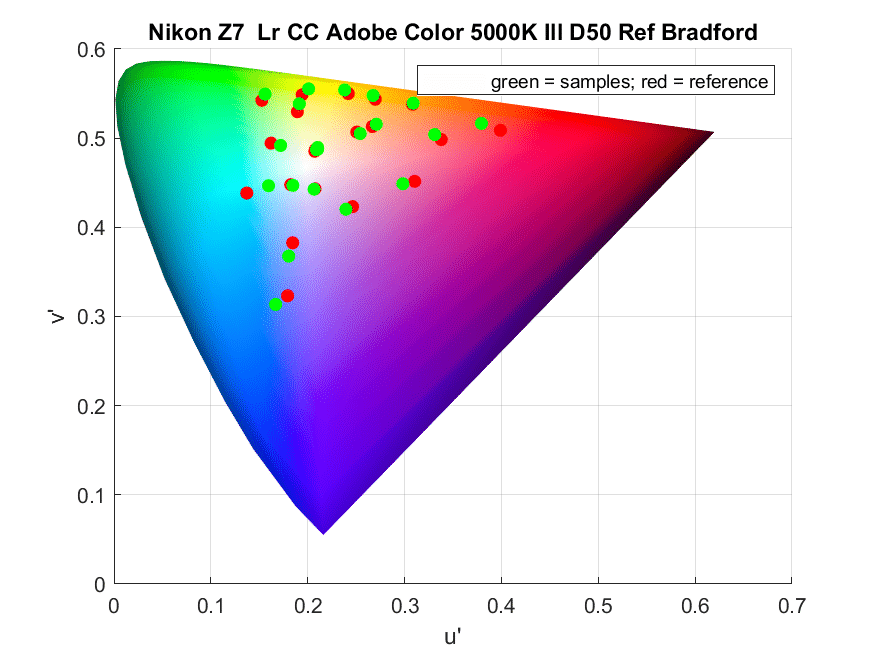
That tells us how much chroma error there is, but not in which direction the error occurs. We can see that by looking at plots of the right chromaticities for each patch vs the measured chromaticities. I’ve chosen u’v’ chromaticity space for these plots, because we can plot the spectral “horseshoe” in that space, unlike Lab.
Note that Caucasian flesh tones are shifted towards red, and magentas are shifted towards blue. That is almost certainly deliberate.
The other most accurate profile:
And our big loser:
And last for this set, the new Adobe default profile:
Adobe Color is to Adobe Standard as New Coke was to Coke, with Capture 1 being Pepsi. It is less accurate, but more pleasing to most.

Jim , pleaseeee can you do this test also with the Sony A7Riii – would love to know what’s really going on with deliberate colour shifts there also.
Thanks!
Good show, Jim. As a reference I get mean dE94 of 2.4 and mean dE00 of 1.4 with the following matrix direct from raw to sRGB:
1.6704 -0.5534 -0.1170
-0.1615 1.6320 -0.4705
0.0188 -0.4292 1.4105
This was obtained off DPR studio scene frame 2099, with the 85mm/1.8G. Frame 2102 produces identical results. The two outliers are skin and cyan at about 4 dE00, all others are pretty well contained.
Very interesting, thanks! I’m assuming a D850 would yield similar results? I personally always thought the Nikon profiles (in LR) looked on the yellow side, and the reds seemed more orange. I just started playing around with the new Adobe Color profile, but it actually looks very nice so far.