• site home
  • blog home
  • galleries
  • contact
  • underwater
  • the bleeding edge

the last word

Photography meets digital computer technology. Photography wins -- most of the time.

You are here: Home / The Last Word / Characterizing the Leica M240, part 1

Characterizing the Leica M240, part 1

September 3, 2013 JimK Leave a Comment

In the next few posts, I’m going to characterize the Leica M (Typ 240), hereafter called the Leica M240, or just the  M240. The first thing I do when I characterize a camera is see if there are self-heating effects that I need to watch out for. If there are, it makes the testing process a real drag, since I have to wait between test exposures. Fortunately, these effect have not usually been material with the cameras that I’ve tested so far.  However, I can’t count of that, so here’s how I test.

I make a series of exposures of the back of the lens cap with the aperture set to the physically smallest opening, the ISO at maximum (not counting the “push” settings, and the shutter speed at 1/4 second (if there’s no long-exposure noise reduction at that setting). The file format was DNG with no compression. In the case of cameras with buffers of a dozen pictures or so like the M240, I make the exposures as fast as the camera can go. I used a Lexar 128 GB 400x (10) SD card, which gave be a sustained rate of about a picture every 3 seconds or so.

Here’s the average noise floor over 64 exposures. I’ve plotted the red and blue channels, and the average of the two green channels over a rectangle that includes the central 90% of the pixels.

self heating m240 3200 4

Self heating is evident, but at a very low level. The trend line change from the beginning to the end of the series is less that .04 stops.

Plotting the standard deviation produces similar results:

m240 noise floor sd 3200 4

While probably not a problem, this is the strongest and most consistant self-heating effect that I’ve observed, so I repeated the results at 1/30 of a second.

The average noise:

m240 avg noise floor 30th 3200

and the standard deviation:

m 240 sd noise floor 3200 30th

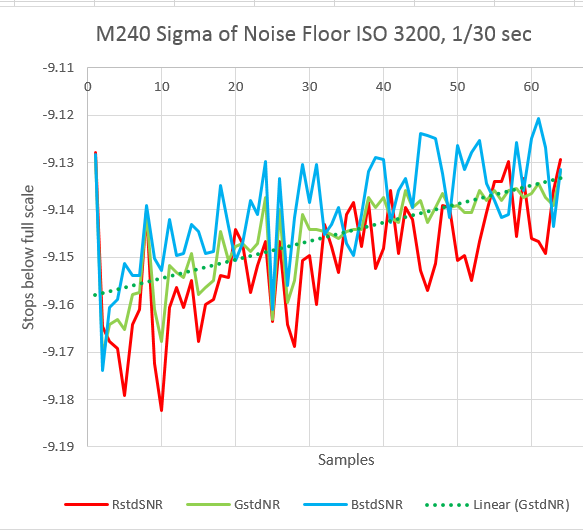
Not much difference.

For completeness, I looked at 1/4000 second exposures. First, the averages:

m240 avg noise 3200 400th

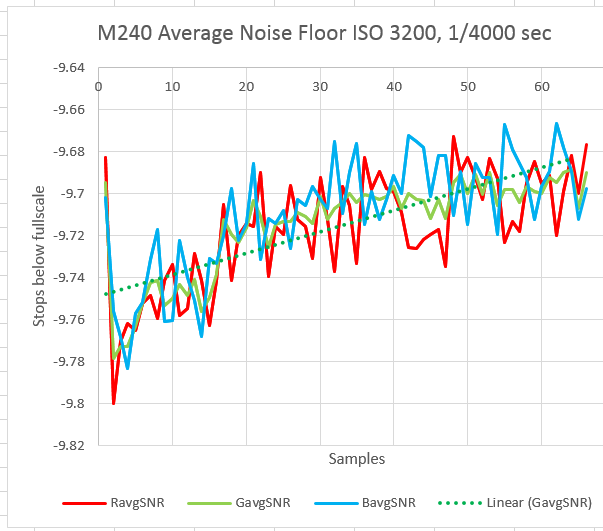
And next, the standard deviations:

m240 std noise 3200 400th

Again, not much difference.

There’s one strange thing in common across all these series; the first exposure has more noise than the next few. What’s that all about? I’ve no idea.

At ISO 200, you can observe the noise floor being quantized by the precision of RawDigger’s resolution, which is 0.01 LSB:

m249 avg noise 200 quarter

The noise at ISO 200 is a full two stops under the Nikon D4’s noise at ISO 100 under the same conditions. It may be that Leica and Nikon apply different offsets.

The standard deviation shows two anomalies in the blue channel:

m240 sd noise 200 quater

Looking at the histogram of the noise floor at ISO 3200 at 1/30th, we see normal behavior, with no evidence of red and blue channel prescaling (note that the horizontal axis is linear and the vertical axis is logarithmic):

noise floor histo 3200 3oth

The histogram at ISO 200 and 1/30 is a more dispositive test for prescaling, and the lack of gaps in the meat of the red and blue histograms indicates that there is none:

noise floor histo 200 3oth

The positive second derivative (holds water) of the ISO 200 histograms in the first ten buckets is unusual, and may be evidence of a negative offset applied to the signals prior to the ADC. If true, this would explain the surprisingly low ISO 200 noise floor.

The Last Word

← A new series Leica M240 noise floor vs ISO →

Leave a Reply Cancel reply

Your email address will not be published. Required fields are marked *

May 2025
S M T W T F S
 123
45678910
11121314151617
18192021222324
25262728293031
« Apr    

Articles

  • About
    • Patents and papers about color
    • Who am I?
  • How to…
    • Backing up photographic images
    • How to change email providers
    • How to shoot slanted edge images for me
  • Lens screening testing
    • Equipment and Software
    • Examples
      • Bad and OK 200-600 at 600
      • Excellent 180-400 zoom
      • Fair 14-30mm zoom
      • Good 100-200 mm MF zoom
      • Good 100-400 zoom
      • Good 100mm lens on P1 P45+
      • Good 120mm MF lens
      • Good 18mm FF lens
      • Good 24-105 mm FF lens
      • Good 24-70 FF zoom
      • Good 35 mm FF lens
      • Good 35-70 MF lens
      • Good 60 mm lens on IQ3-100
      • Good 63 mm MF lens
      • Good 65 mm FF lens
      • Good 85 mm FF lens
      • Good and bad 25mm FF lenses
      • Good zoom at 24 mm
      • Marginal 18mm lens
      • Marginal 35mm FF lens
      • Mildly problematic 55 mm FF lens
      • OK 16-35mm zoom
      • OK 60mm lens on P1 P45+
      • OK Sony 600mm f/4
      • Pretty good 16-35 FF zoom
      • Pretty good 90mm FF lens
      • Problematic 400 mm FF lens
      • Tilted 20 mm f/1.8 FF lens
      • Tilted 30 mm MF lens
      • Tilted 50 mm FF lens
      • Two 15mm FF lenses
    • Found a problem – now what?
    • Goals for this test
    • Minimum target distances
      • MFT
      • APS-C
      • Full frame
      • Small medium format
    • Printable Siemens Star targets
    • Target size on sensor
      • MFT
      • APS-C
      • Full frame
      • Small medium format
    • Test instructions — postproduction
    • Test instructions — reading the images
    • Test instructions – capture
    • Theory of the test
    • What’s wrong with conventional lens screening?
  • Previsualization heresy
  • Privacy Policy
  • Recommended photographic web sites
  • Using in-camera histograms for ETTR
    • Acknowledgments
    • Why ETTR?
    • Normal in-camera histograms
    • Image processing for in-camera histograms
    • Making the in-camera histogram closely represent the raw histogram
    • Shortcuts to UniWB
    • Preparing for monitor-based UniWB
    • A one-step UniWB procedure
    • The math behind the one-step method
    • Iteration using Newton’s Method

Category List

Recent Comments

  • JimK on How Sensor Noise Scales with Exposure Time
  • Štěpán Kaňa on Calculating reach for wildlife photography
  • Štěpán Kaňa on How Sensor Noise Scales with Exposure Time
  • JimK on Calculating reach for wildlife photography
  • Geofrey on Calculating reach for wildlife photography
  • JimK on Calculating reach for wildlife photography
  • Geofrey on Calculating reach for wildlife photography
  • Javier Sanchez on The 16-Bit Fallacy: Why More Isn’t Always Better in Medium Format Cameras
  • Mike MacDonald on Your photograph looks like a painting?
  • Mike MacDonald on Your photograph looks like a painting?

Archives

Copyright © 2025 · Daily Dish Pro On Genesis Framework · WordPress · Log in

Unless otherwise noted, all images copyright Jim Kasson.