In previous work for a project about observer metameric errors in digital cameras, I built a program that, given a target color and a set of sample reflectance spectra, will:
- Using principal component analysis, find a set of basis functions for the sample set
- Assuming the set is lit with a particular illuminant (I used D50 for the data I’m presenting here), find as many spectra as you specify by combining the basis functions.
- All of the spectra will resolve to the same color for a CIE 1931 2-degre observer. They are therefore metamers.
- I set the boundary conditions to exclude spectra with over 100% or less than 0% reflectance
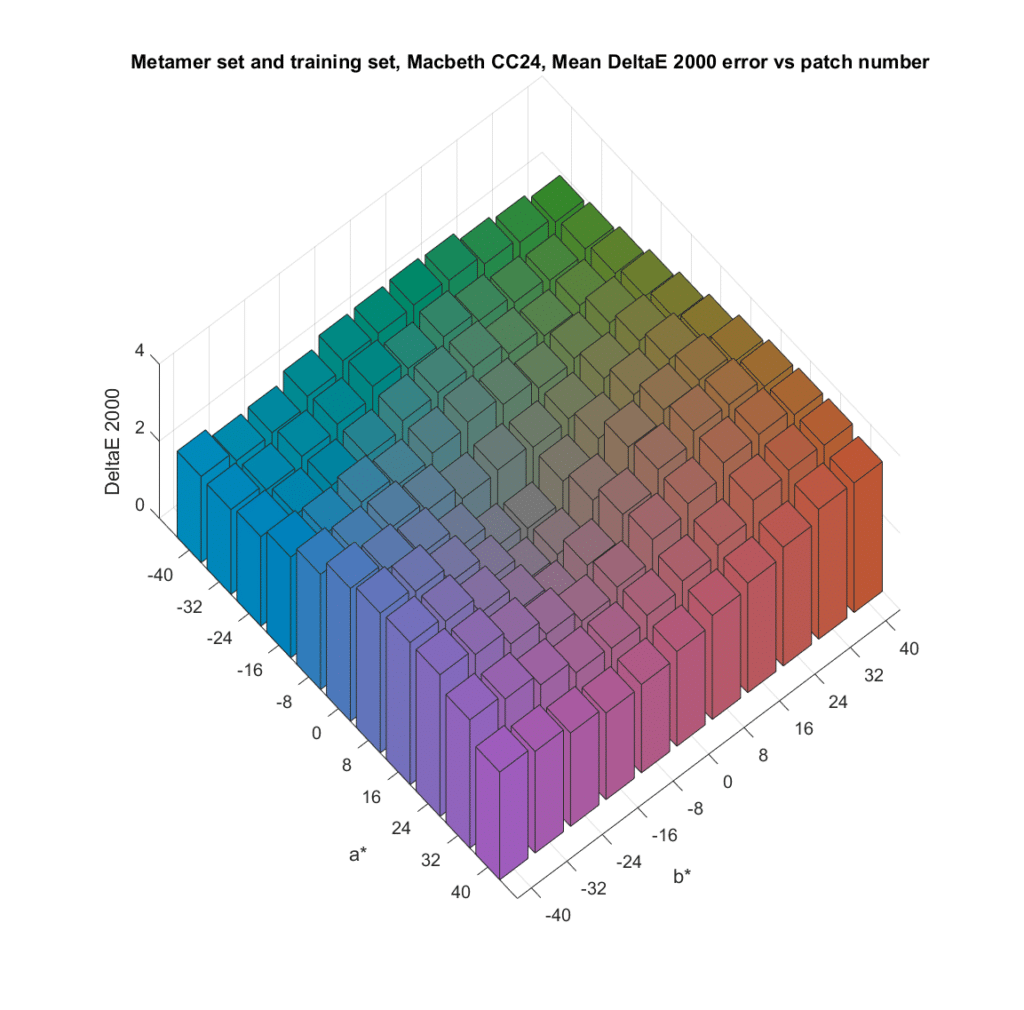
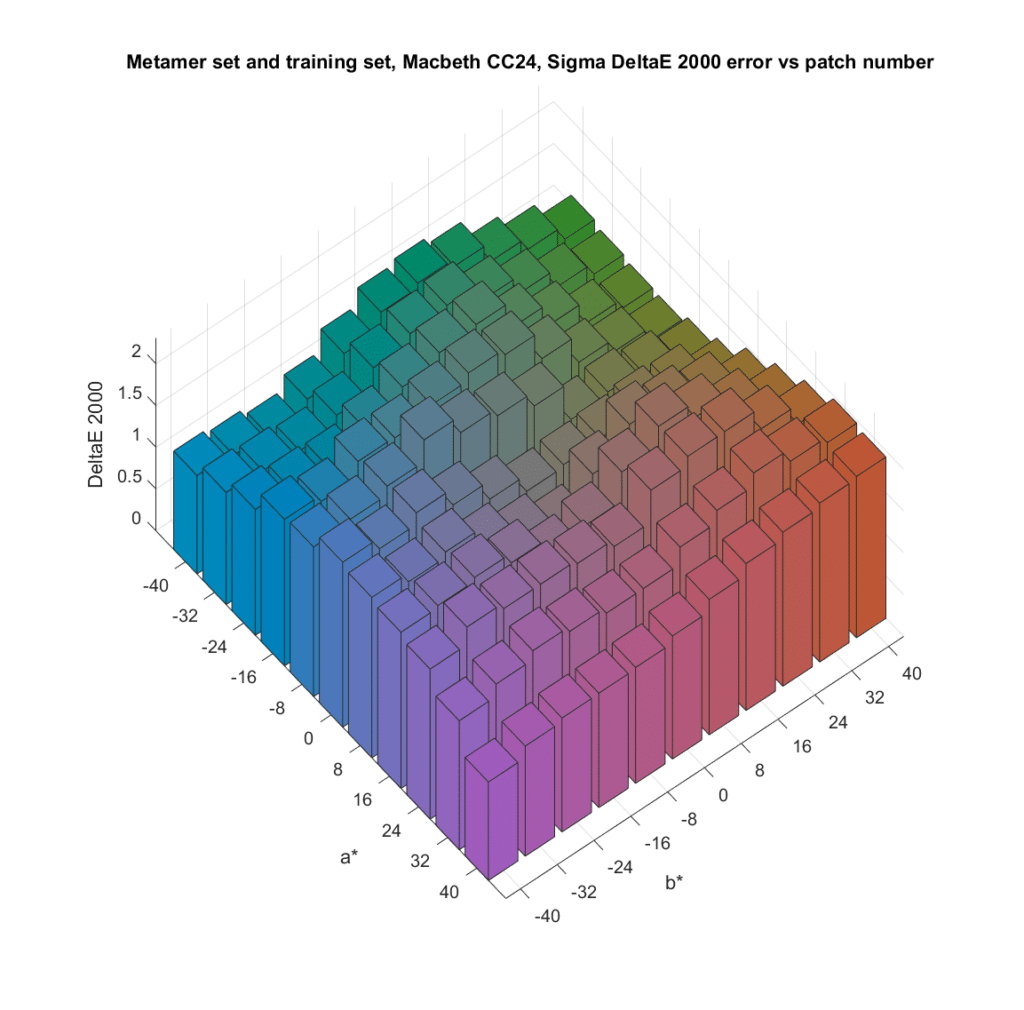
In an earlier post, I explored the results of using a large number of metamer sets based on a natural spectra database I have. For this post, I sampled the chromaticity more finely, and switched to the Macbeth CC24 chart, rather than the natural color spectra . I generated metamer sets, all with L* of 50, with a* starting at -40 and increasing in steps of 8 to 40, and b* covering the same range. I tested with 43 simulated cameras, which gave me a lot of data. I’ll show you the average of the mean CIELab DeltaE 2000 errors across all the cameras, for all the colors in the metamer sets. I’ll also show you the average of the standard deviations (sigmas) of the CIELab DeltaE 2000 errors across all the cameras. That is an indicator of observer metameric error, since for the standard observer that I used all the metamers in a set are the same color, and the sigma of the CIELab DeltaE 2000 errors would be zero.
The mean DE2K first;
As before, this shows the average error to be the smallest near the gray axis.
Now we’ll look at the metric for observer metameric error:
As before, the smallest average observer metameric error occurs near the gray axis, where we saw the lowest absolute errors.
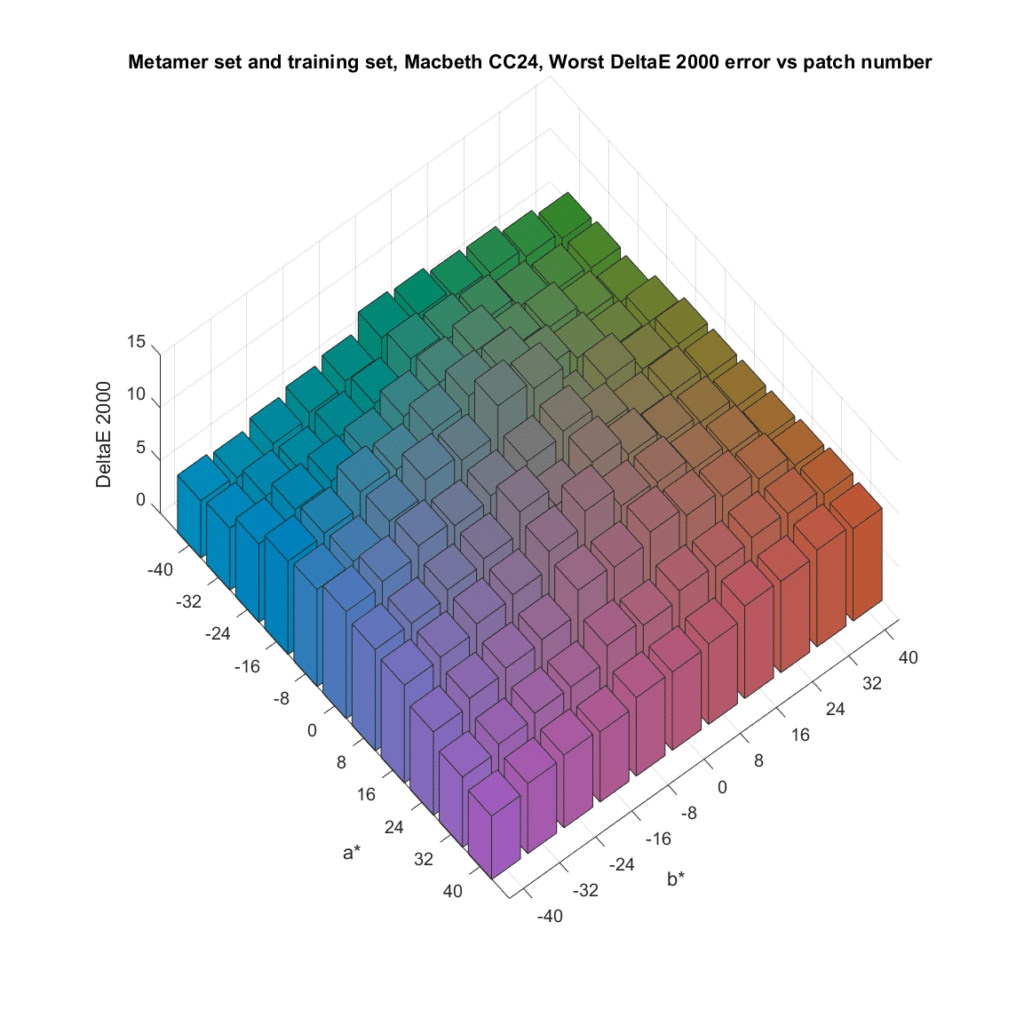
The worst-case errors:
It looks like the advantage held for the standard deviation near the gray axis doesn’t hold for the worst errors. From the values for the worst errors we’re seeing here, it looks like the probability density function has a long tail.
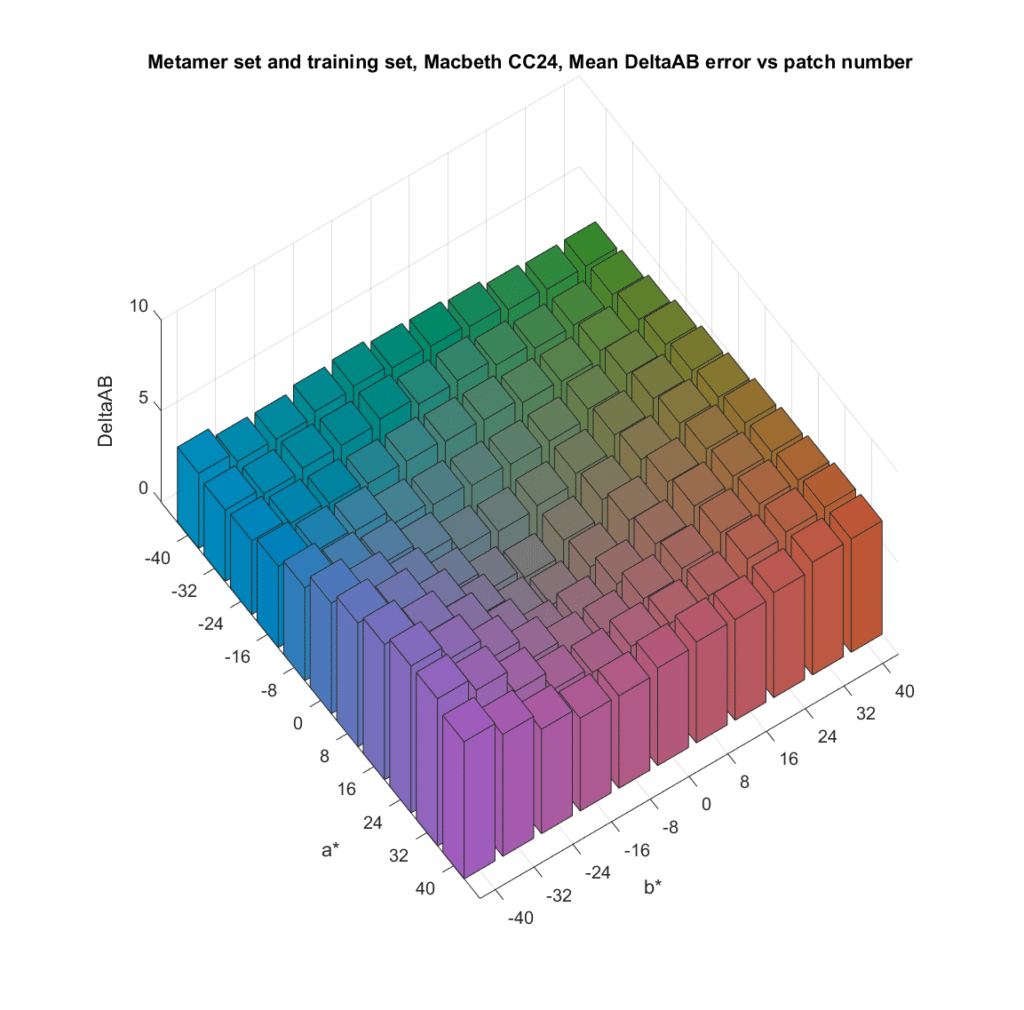
Now I’ll so the same thing, but instead of looking at DeltaE 2000 errors, I’ll look only at the chromaticity errors;
The mean chromaticity errors in general follow the pattern sett by the mean DeltaE 2000 errors. The numbers are not sirectly comparable, since the DeltaAB errors were computed using the 1976 formulae, while the DeltaE 2000 errors were computed using a later formula.
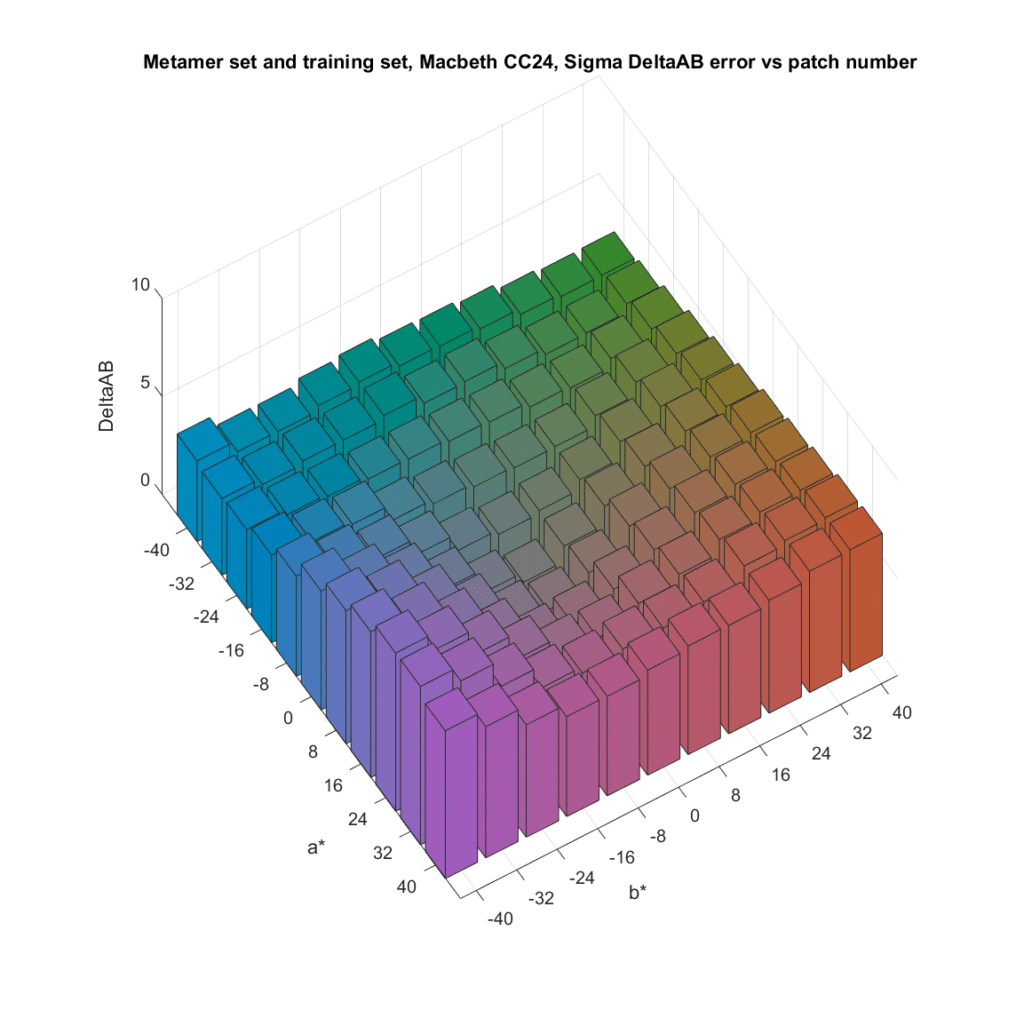
The standard deviations, which measure observer metameric error:
Same thing.
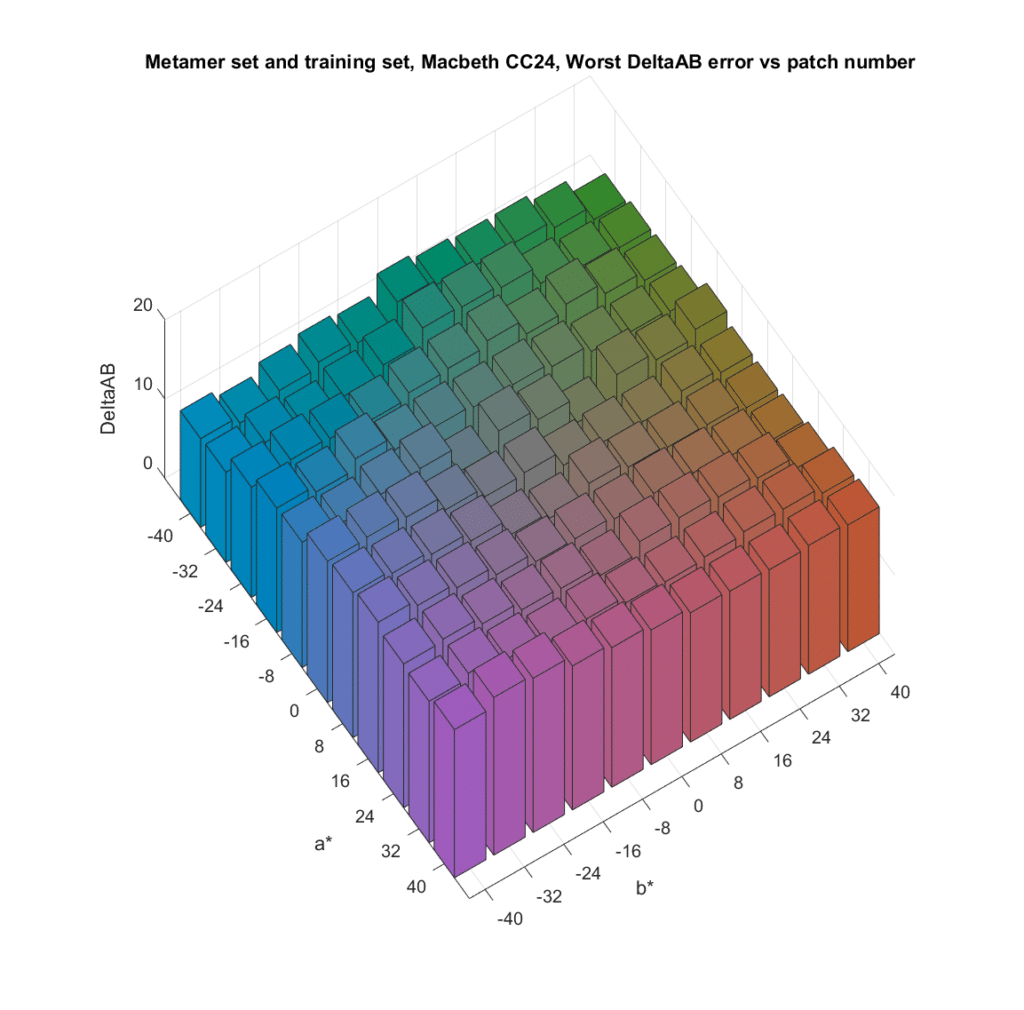
The worst-case chromaticity errors:
Leave a Reply