This is one in a series of posts on the Sony alpha 7 R Mark IV (aka a7RIV). You should be able to find all the posts about that camera in the Category List on the right sidebar, below the Articles widget. There’s a drop-down menu there that you can use to get to all the posts in this series; just look for “A7RIV”.
I don’t have my a7RIV yet, but I received a set of uncompressed dark frames today from the camera. The were made at 1/8000 second shutter speed, and I think, but do not know, that they were made with no lens attached (the metadata says: E-Mount, T-Mount, Other Lens or no lens so that’s probably a safe bet), so that Sony’s lens corrections won’t mess up the files. I will digress for one sentence: Sony, please, pretty please, stop futzing around with the raw values in your files; instead, put the recipe for what you want done in the metadata fields.
Here’s the Engineering Dynamic Range (EDR) — which I’m defining as full scale over read noise (and yeah, I know that’s not the high road, but it sure improves my ability to measure it accurately.
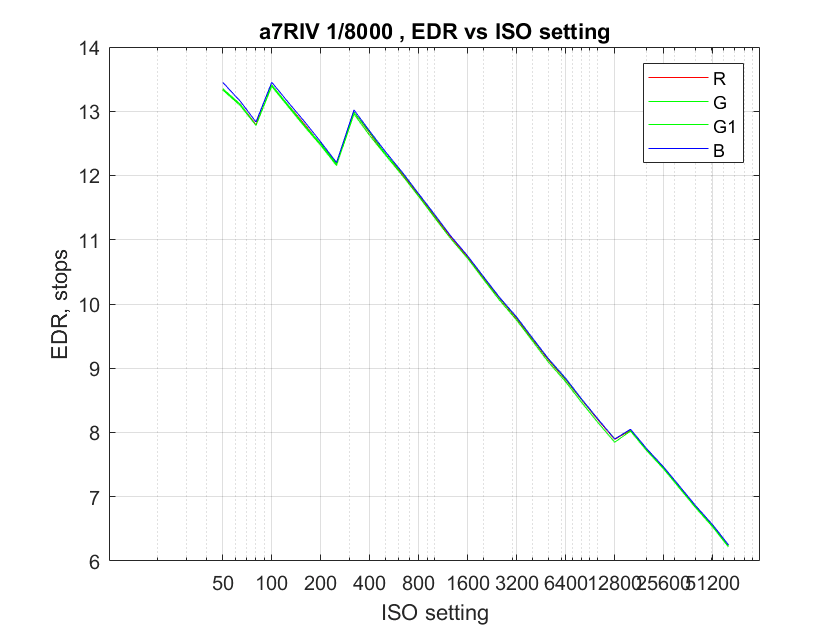
The ISOs from 50 through 80 are the usual Sony shuck and are achieved by setting the ISO onoe full stop higher than the one dialed in, adding one stop of positive exposure compensations, brightening up the JPEG preview image, and adding metadata to tel the raw developer to do the same. Now that it’s clear that Sony hasn’t changed its low-ISO ways, let’s ignore those settings:

There is a surprise here. The camera switches the conversion gain into its high mode on the transition from ISO 250 to ISO 320. That’s two-thirds of a stop earlier than the GFX 100 and the IQ4 150 MP. Fuji changed that setting in a firmware release. Will Sony do the same? This is firmware 1.00. The improvement in EDR that happens above ISO 12800 is smoke, mirrors, and digital signal processing. The camera starts doing low-pass filtering there. We’ll see that in the frequency plots immediately below. Otherwise, this is precisely what we would expect from looking at the GFX 100 and the Phase One IQ4 150 that also employ the new BSI Sony 3.76 micrometer (um) sensors.
By the way, the Bayer pattern is what we’ve come to expect from Sony: RGGB.
At ISO 50, the read noise spectrum is a little funky:
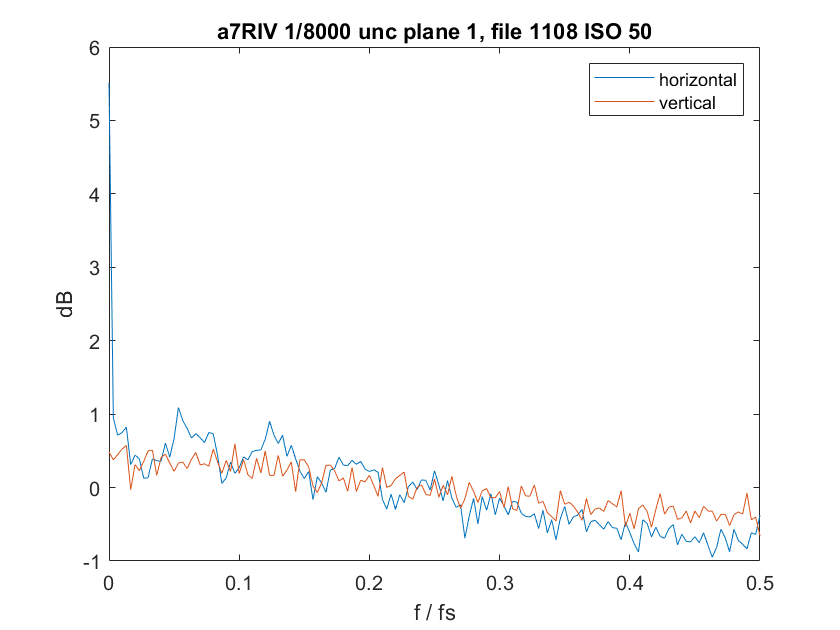
The above is for the R raw plane. I’m not going to spend any more time on that since it’s for an ISO setting that few will use.
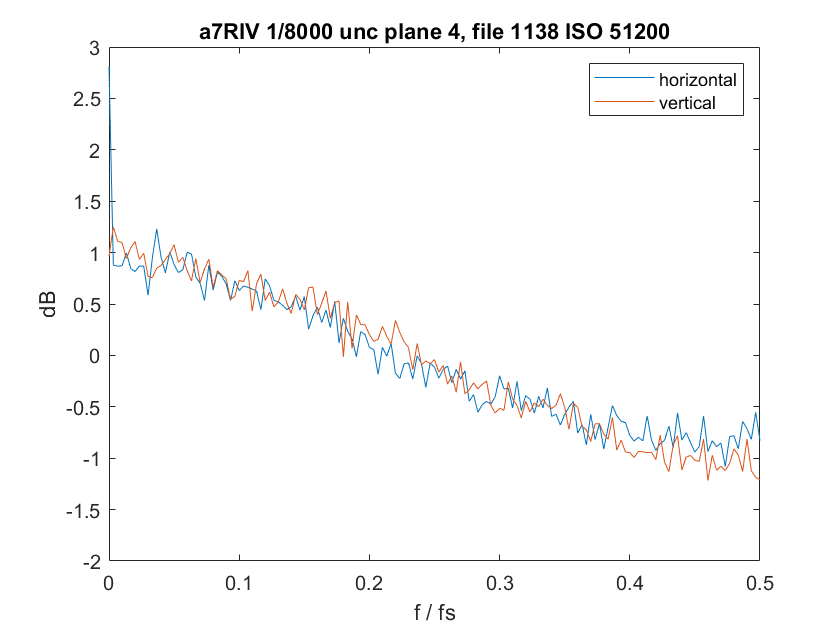
At ISO 100 (Plane 1 is R, plane 2 is G, plane 3 is G1, and plane 4 is B):

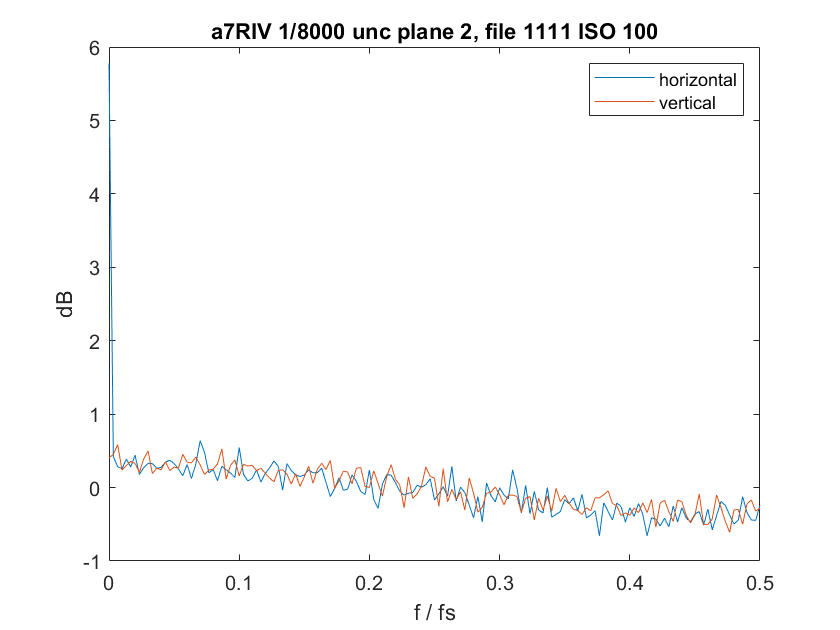
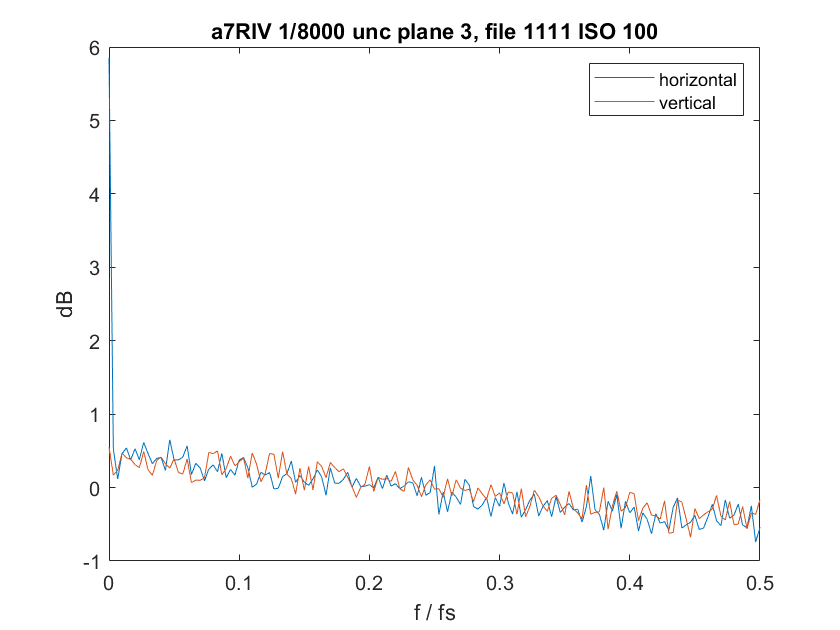
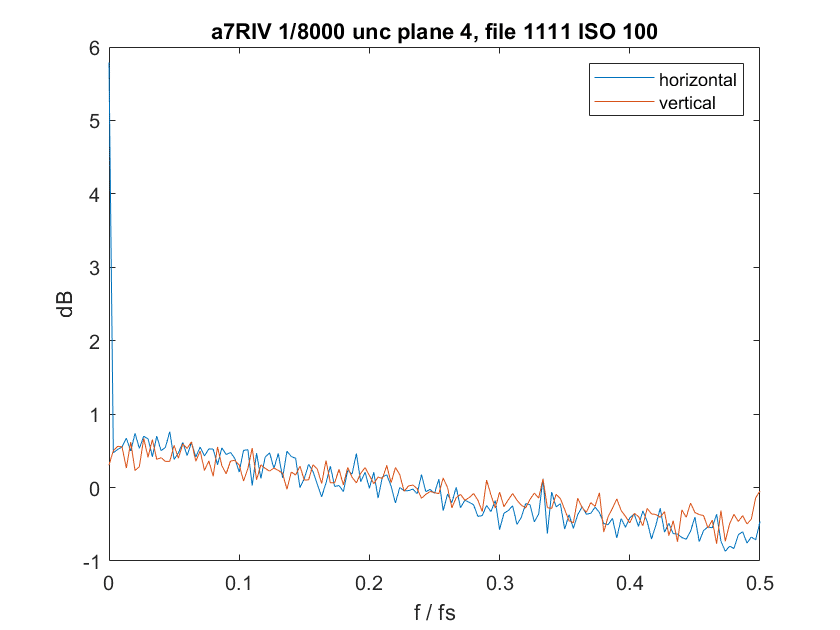
There is mild rolloff of the high frequencies, but there are no periodic signals like we saw with the GFX 100.
ISO 640:
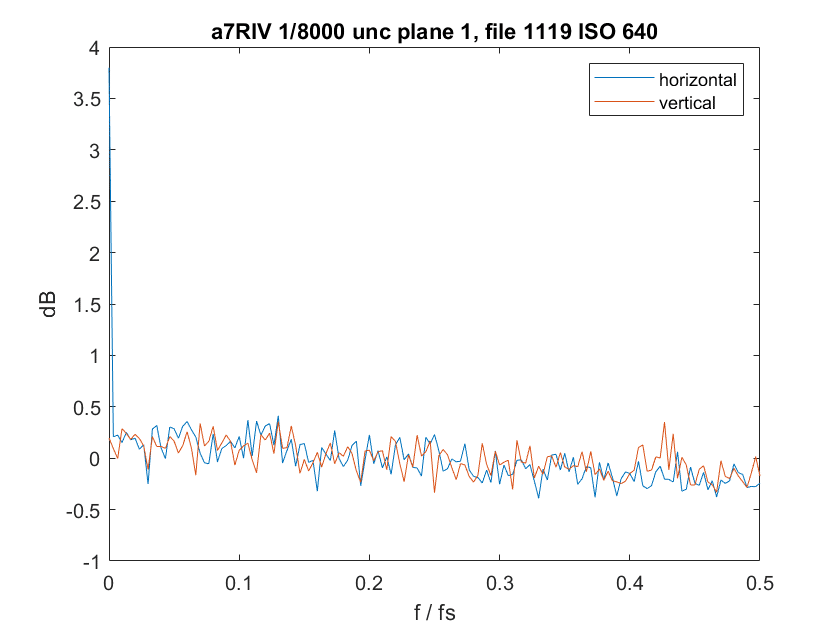
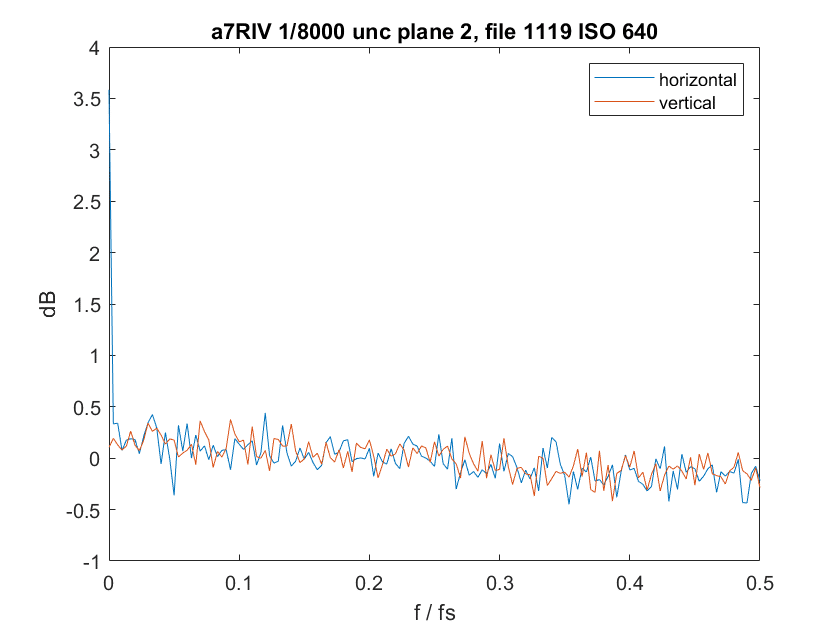
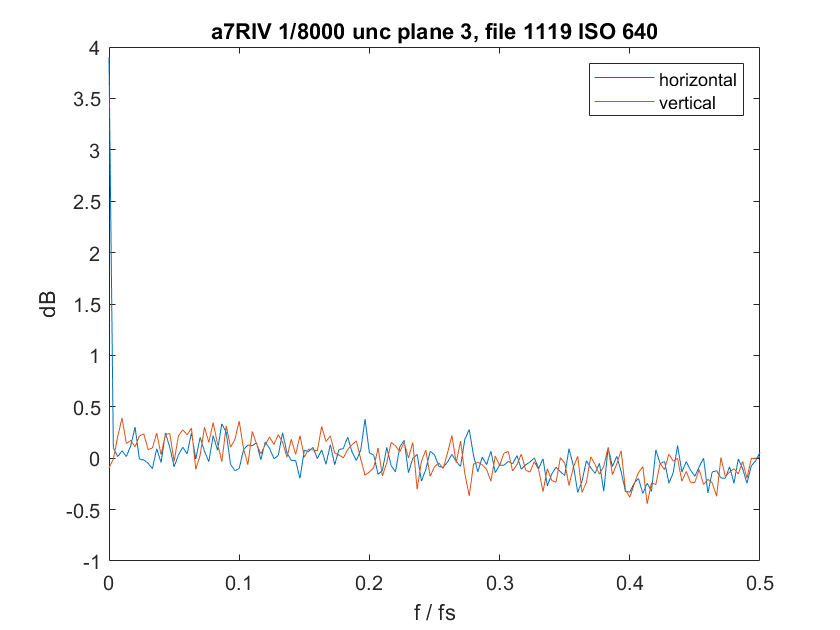
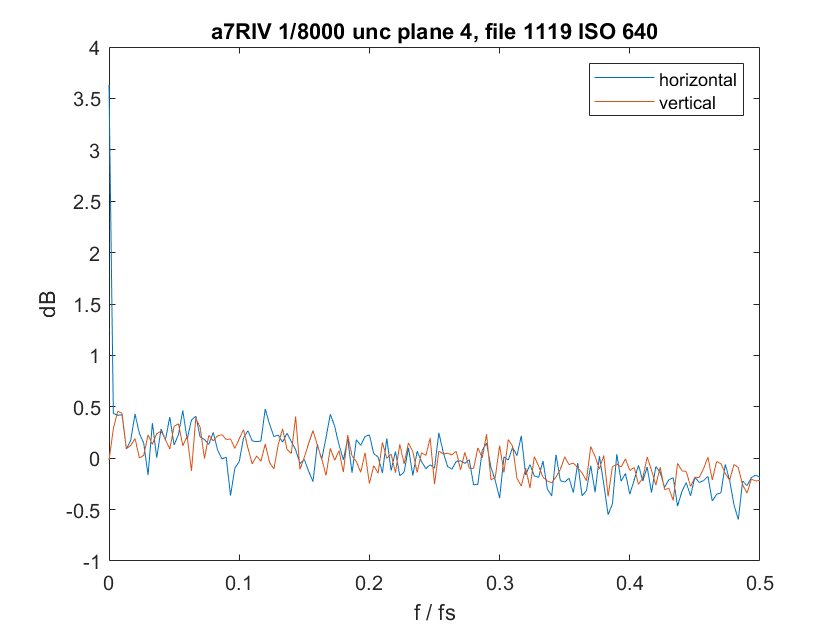
The high-frequency rolloff is getting weaker as we go up in ISO.
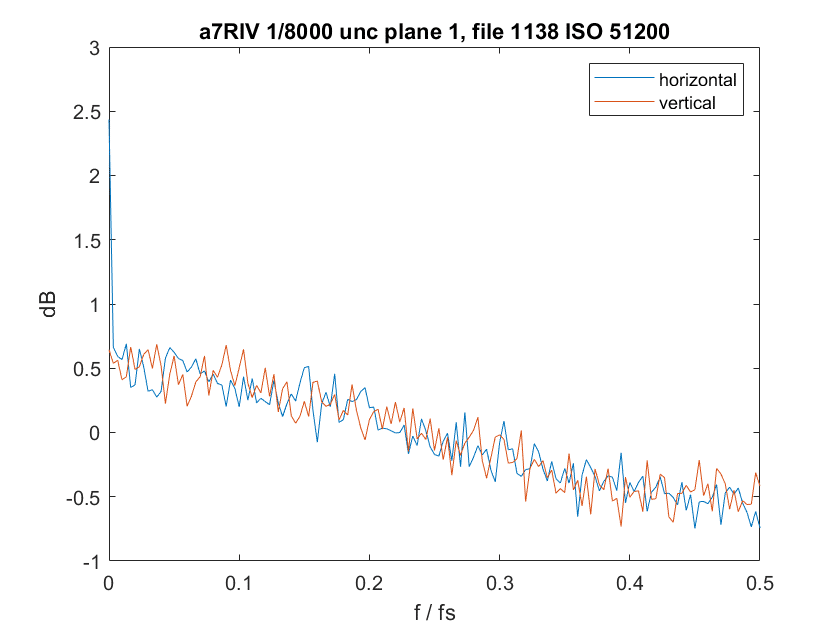
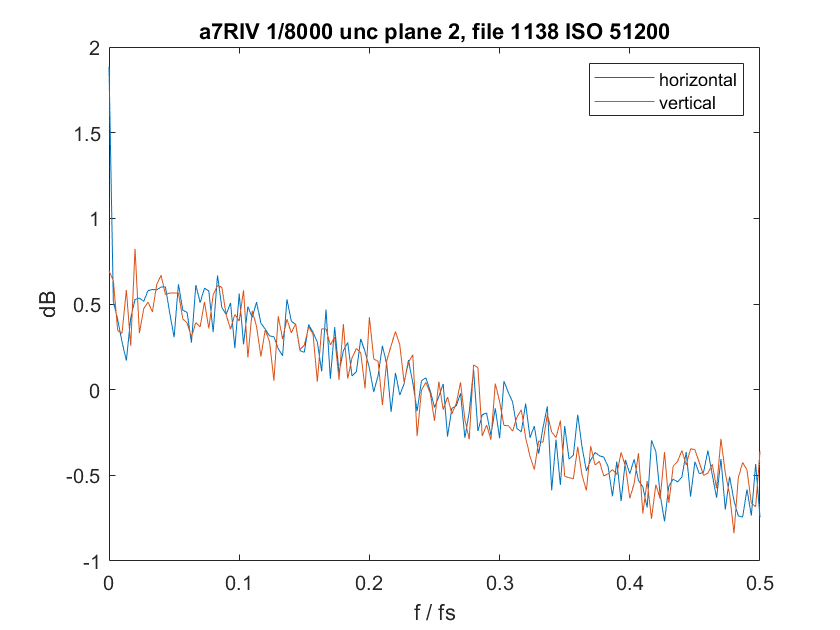
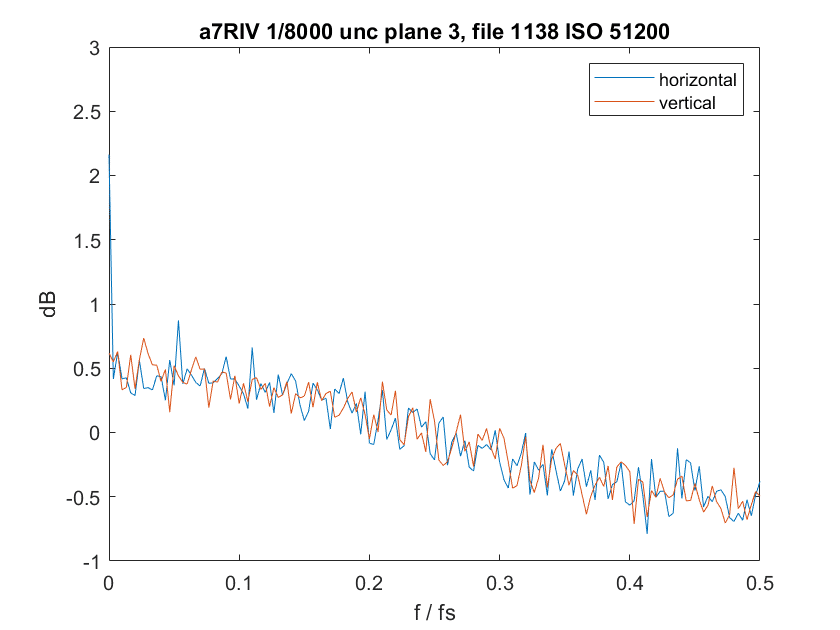
I’ll skip to the highest ISO with no obvious digital signal processing in the EDR plot:
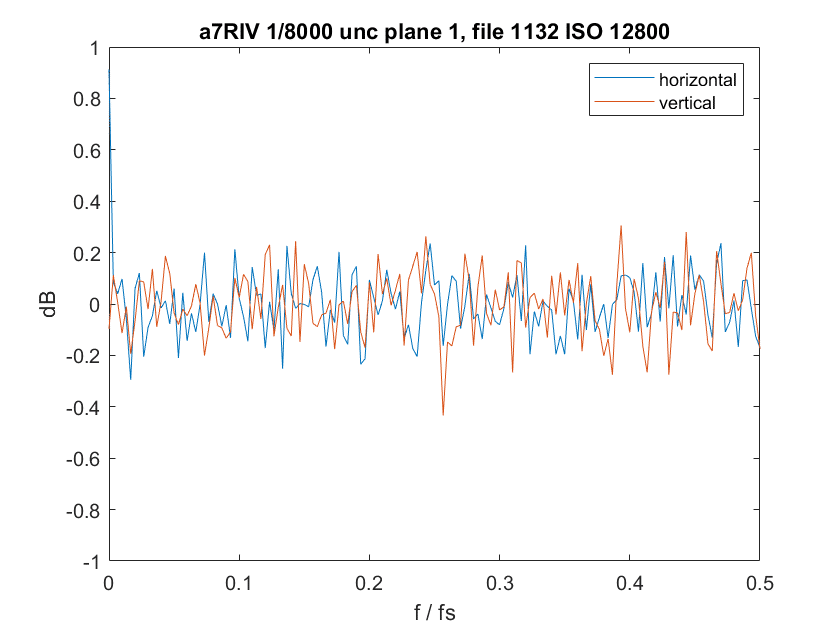
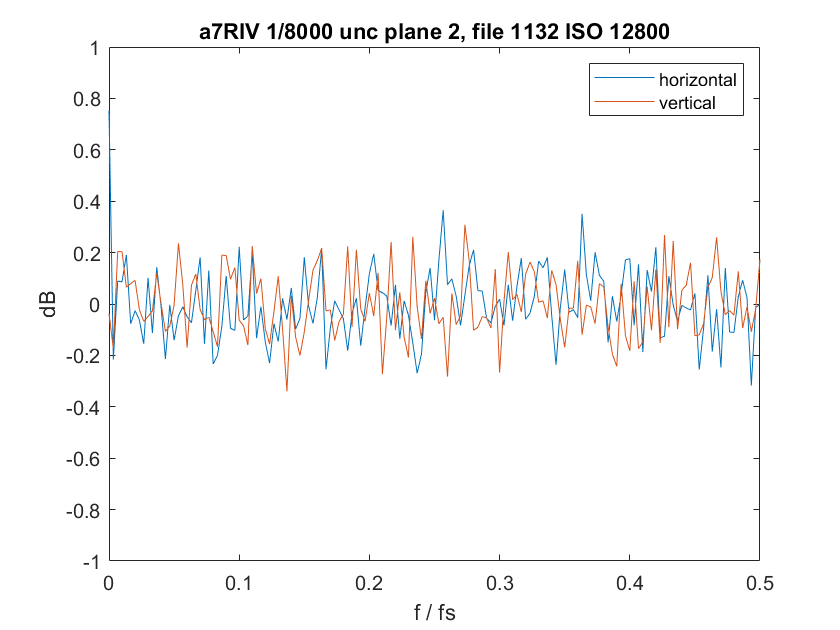
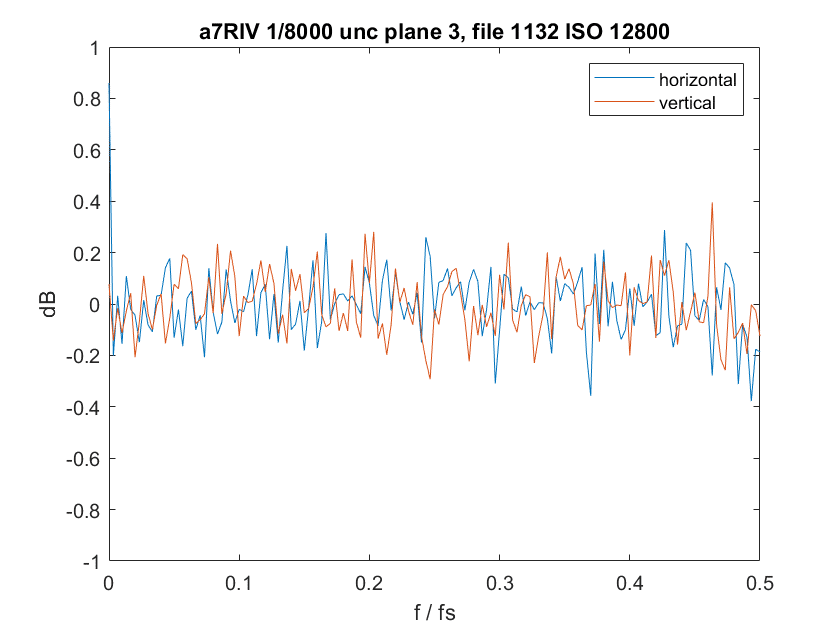
The R, G, and G1 planes are pretty flat, but noisy since there’s a lot of noise at these high ISOs. The blue plane is rolled off. I didn’t show you all the graphs, but as the ISO setting has gone up, this has become more apparent. This looks to me like interpolation over some pixels in the blue plane, probably those used for on sensor phase detect autofocus.
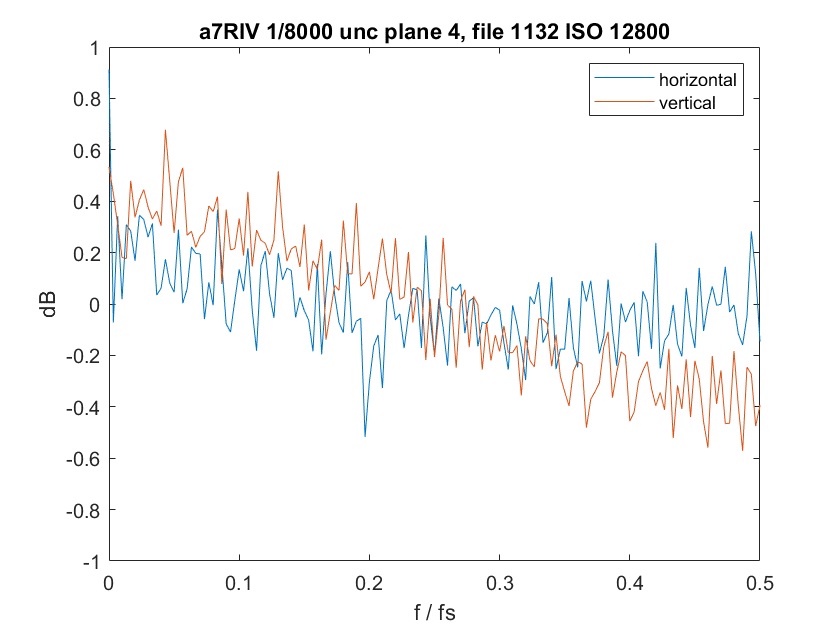
Let’s set the ISO to Ludicrous Mode:
Low-pass filtering everywhere, and even more in the blue plane.
From this data, I’m surmising that the a7RIV wont have the same PDAF banding the plagues the GXF 100 and the Nikon Z cameras. I’m relieved. I may have PDAF striping, but that’s the lesser of the two evils.
Interesting Jim. I forget: to generate the spectrograms do you use every available pixel or just pixels from a smaller target area?
These are from a 600×600 sample. I’ll rerun the code with the whole frame selected and see if there are any differences.
Here are the full-frame spectra:
https://blog.kasson.com/a7riv/more-sony-a7riv-dark-field-spectra/
The r3 has a menu setting for high isoNR on or off.
Do you know if the frames you were given were made with that on or off?
Cheers
David
I think off, but I’m not 100% sure. Do you know the EXIF field with that information?
No I don’t know, but it does seem like the settings for high ISO NR only apply to JPEGs, so there’s no co troll over the spatial filtering. Sorry!
Found it:
Long Exposure Noise Reduction : Off
High ISO Noise Reduction : Off
If you compare this data to the measurements you did with the GFX100, there is a 0.25stop difference at base ISO and 0.4stops with HCG. If that is true that really interesting, as the pixels are supposed to be the exact same size.
Could be sample or temperature variation. I’ll get another sample soon, I hope.
Battery temp was 30 degrees C. Camera temp was 24 deg. C.
Are you making an assumption about full well capacity? If so, what is it and how did you get it?
This is EDR, so I don’t need to make any assumptions about FWC. I’m guessing it will be between 40000 and 50000 electrons.