Sony has announced a 61 megapixel (MP) successor to the hugely-successful 42 MP alpha 7R mark III (aka a7RIII), with the unimaginative moniker of alpha 7R mark IV (aka a7RIV). The wording of the announcement has some people saying that the new camera will have far greater photographic dynamic range than the previous version.
Time will tell, but I don’t think so. The reason is that Sony has introduced a line of sensors with the same 3.76 micrometer (um) pixel pitch in three different sizes, and the pixel designs of the two versions that are currently shipping (or maybe, in the case of the GFX 100, dribbling would be a better word) appear to be very similar, if not identical.
Let’s start out by comparing GFX 100 simulated normalized signal-to-noise ratio (SNR) plots based on Bill Claff’s read noise measurements and mine (I used samples provided by Lloyd Chambers).
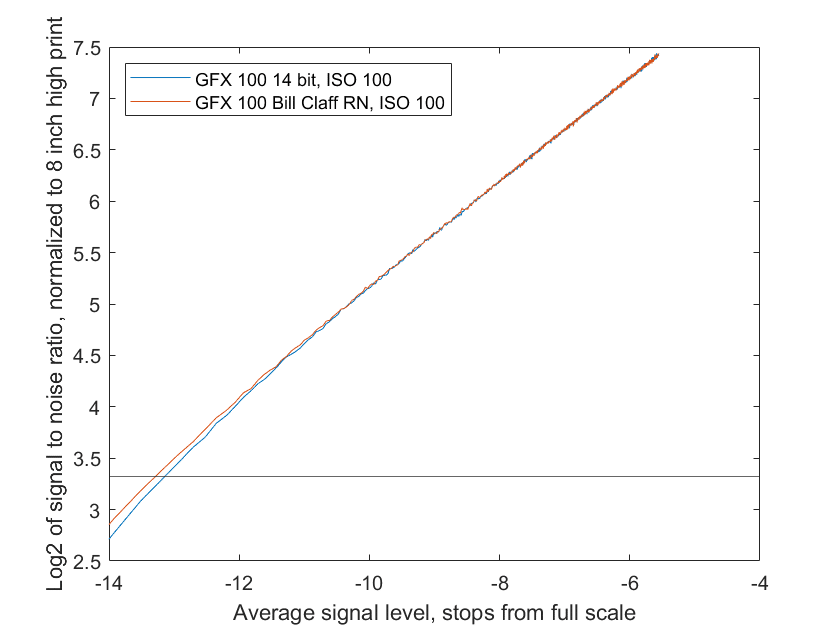
I assumed a full well capacity (FWC) of 47000 electrons for both cameras. The horizontal axis is the signal level in stops from clipping. We are looking at the shadows here. When you get down to 10 stops or so below full scale, you’re looking at shadows so dark that they will appear black in the absence of applying boost in postproduction. The vertical axis is the SNR, normalized to that seen by an average person with an 8 inch high print about 18 inches away from the eyes. The black horizontal line defines the Claff Photographic Dynamic Range (PDR). Both cameras are close, but Lloyd’s test camera has more read noise.
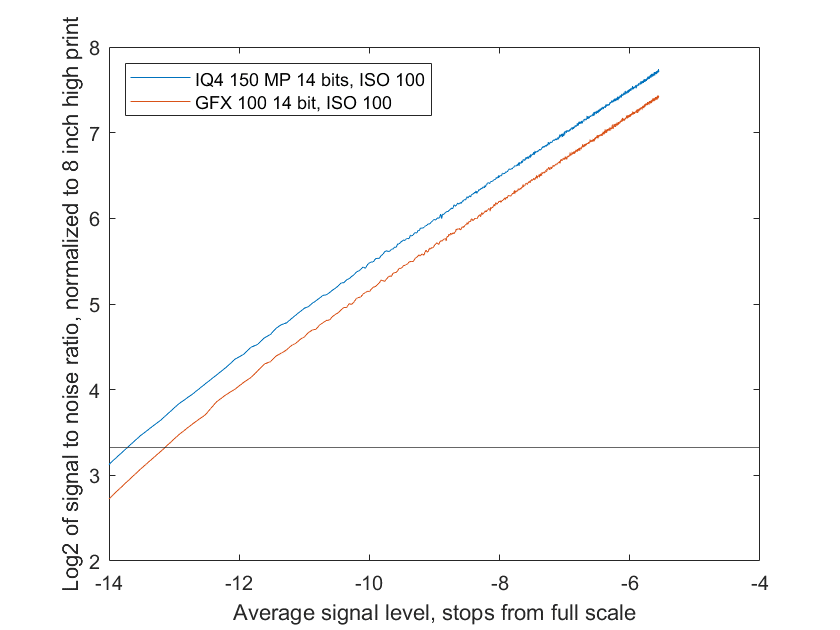
Now let’s look at the curves for Bill’s measurements of the Phase One IQ4 150 MP and mine for the GFX 100.
What if we crop the IQ4 150 MP to the same picture height in pixels as the GFX 100?
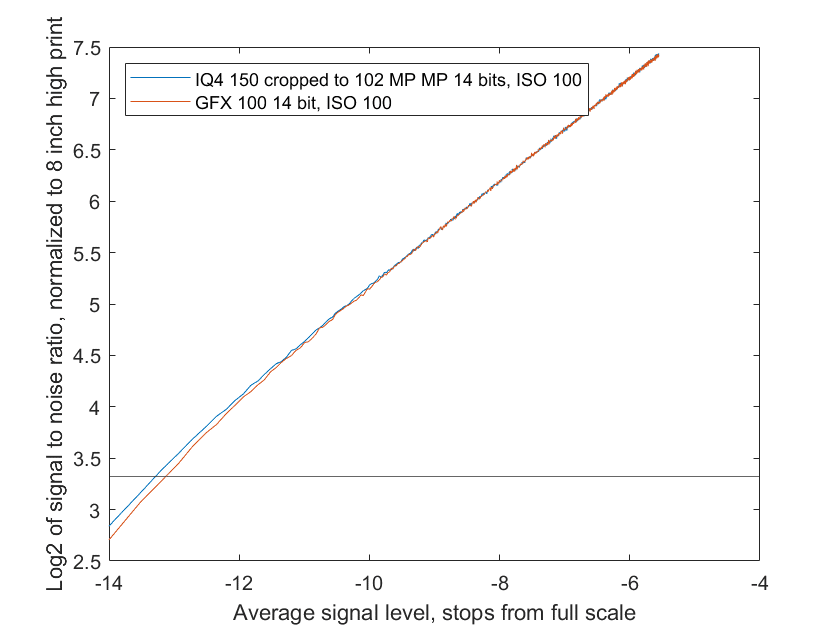
The differences are just about the same as the differences between my numbers for the GFX 100 and Bill’s. If I’d have used Bill’s read noise, they would be right on top of each other.
Now I’ll assume the same pixel design indicated by my measurements of the GFX 100 and simulate what would happen if that design were used in the a7RIV, comparing that with my measurements of the a7RIII.
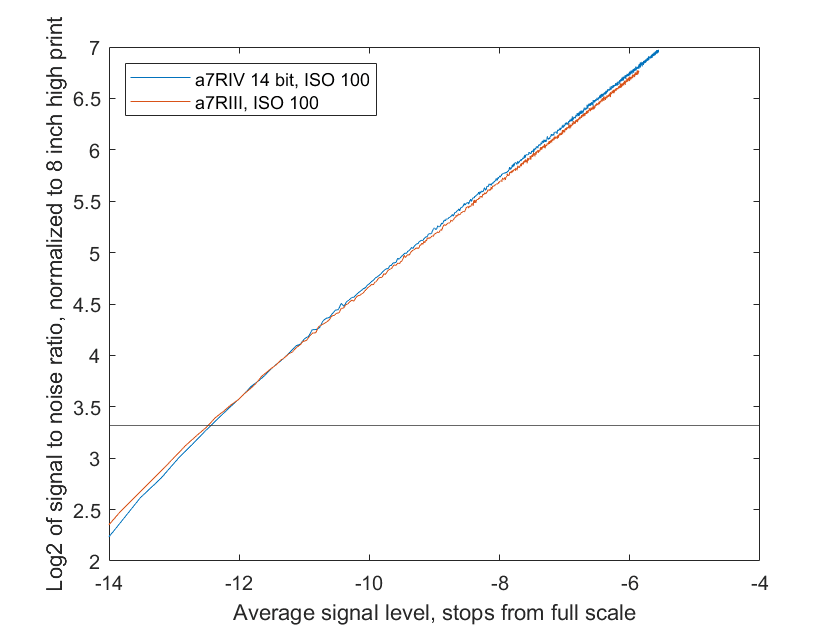
The cameras have very similar SNR curves. If Bill’s test results are more indicative of the typical GFX 100 than mine, the SNR in the deep-shadow end of the a7RIV will very slightly exceed that of the a7RIII. But even then, there will be no material difference between the two cameras in terms of shadow noise.
So, unless Sony has a trick up their corporate sleeve, the photographic dynamic range of the a7RIV is going to be about the same as the a7RIII.
Note: all the comparisons are done at 14-bit precision. The GFX 100 and the IQ4 150 MP do very slightly better at 16-bit precision.
I absolutely adore that Sony is advertising a 15-stop dynamic range but only saves 14-bit raw files.
Also, in the third to last paragraph, do you mean that the noise in the shadow end of the IV will exceed the III? It appears from the graph that the III shows better SNR in the shadows.
I mean the SNR of the a7RIV will exceed that of the a7RIII if Bill’s GFX 100/IQ4 150MP RN numbers pertain. I’ve added clarifying words. Thanks for pointing out the ambiguity.
The quoted DR by Sony is the same as for r3. The only suggestion it might be better is the word ‘enhanced’ before the 15 stop (normalised for 8mp image) claim.
But my guess is that enhanced here means either nothing, or that the DR is enhanced in the sense of being the same with a decent increase in resolution- which is fair.
The X-T3 and X-T30 are also using this sensor technology and pixel pitch, so including the Sony A7R4, there are now at least 5 models in the field with this kind of BSI sensor tech.
So the look of this chart doesn’t come as a surprise: http://www.photonstophotos.net/Charts/PDR.htm#FujiFilm%20GFX%20100(FF),FujiFilm%20X-T3,Sony%20ILCE-7RM3,Sony%20ILCE-7RM3(APS-C)
Btw: I have sent new GFX 100 sample image sets to Bill Claff, so he could verify that the GFX 100 Dual Conversion Gain level is indeed ISO 500 with current production firmware. Bill has since updated his charts.
I’m in no way as technical as you guys, but it seems to me that many of the A7RIV claims being made about dynamic range and medium format like quality are for shots using pixel-shift mode?
Would dynamic range improve in pixel-shift ?
Yes, just as it does in the a7RIII. The improvement is the same as if you averaged four shots with no pixel shifting.
I don’t know.
If the number of shots is n, the noise will be reduced by a factor of sqrt(n). 4 shots gets you half the noise, 16 shots a quarter, and 64 shots an eighth, and so on.
Thank you. Since one can get Sony A7R or A7RII for a song and the SR App cost only $10, what would be justification for switching to A7R IV? I am sure the new Sony is a great camera but for whom should it be the must-have camera?
You — and only you — can answer those questions for yourself.
How would the PDR data and camera comparisons change if we considered a definition of PDR that was based on larger prints. The current definition is based on 8″ tall prints at a particular viewing distance which defines a COC. I would not buy any of these high resolution cameras to make such small prints viewed from arms length distance. Large prints viewed close up is the motivation for such cameras.
One of the great things about the normalized shadow SNR charts that I post is that you can decide for yourself where you want to draw the horizontal line that defines the threshold SNR for computing the PDR. In the case of a 16 inch high print viewed at 18 inches, you’d move it up by a factor of two. Since log2(2) = 1, and multiplying means adding logarithms, you’d move it up 1 unit, from just under 3.5 to just under 4.5.
Sony’s 15-stop DR claim for the A7rIV is based on an 8MP downsampled image, per Dpreview’s Richard Bulter. Source: https://www.dpreview.com/articles/3979321923/sony-a7r-iv-what-you-need-to-know
As you can see by the graphs, I get between 12 and 13 stops of DR when downsampled to 8 MP using the SNR = 10 threshold.
Understood Jim. I thought it useful to contextualize where Sony’s 15EV of DR came from. We know the A7rIII engineering DR was 14.7EV downsampled to 8MP, so Sony’s claimed 15EV of downsampled EV @ 8MP represents an improvement of 0.3EV over the A7rIII.
Assuming they are using the same numerator for the threshold SNR, which they’ve not specified, as far as I know. Do you think they are using SNR = 0?
Fair point Jim. I assumed they’re using an SNR threshold of 1:1 since that’s what DxOMark uses, and so what Sony likely believes is the most widely-disseminated DR measurement. This would also dovetail with Sony’s choice of an 8MP downsample, which is also what DxOMark uses for their published ‘print’ DR measurement.
I can run the graphs with the SNR set that low (that would 0 on the vertical axis, but I don’t think the numbers would be photographically relevant. I can see scaling higher thresholds (but, with modern cameras, even 10 is getting kind of low), but I think it makes no sense to scale EDR or anything close to it.
Agreed but since when did camera marketing departments concern themselves with photographically-relevant measures 🙂 These are the same companies that tout maximum ISOs of 409,600.
Touche.
I’m sorry what does the horizontal line indicate (the one around 3)
The horizontal line indicates the Claff photographic dynamic range delimiter. SNR of 10 on the reference 8 inch high print when viewd from the reference distance.
Also where is the 47000 electrons capacity used ?
You need the FWC to calculate the input-referred read noise in electrons, and to calculate the photon noise.
Fred Miranda wrote : I could be wrong but I think that averaging images (with or without pixel shift) always improve DR and SNR. At least I see it in my images. Yes, I agree. I don’t know if that is the source of enhanced dynamic range that Sony is claiming. I doubt it, but since they have provided no specific information on what they mean by enhanced dynamic range and how it is achieved, we are left to speculate.