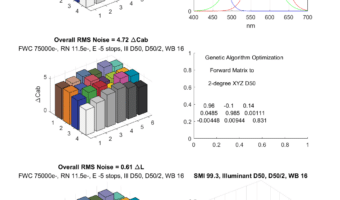
A long-time reader commented on the previous post: One aspect of low light performance is low noise under warm lighting. At sub-2700K, many older cameras end up with tremendously large WB multipliers for the blue channel, when compared to “modern” CFAs. I decided to take a look at that. I’ll show you what I found,… [Read More]
Visible noise and CFA filter spectra, part three
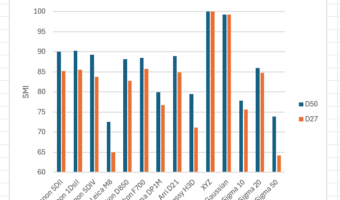
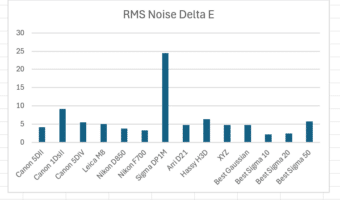
I’ll now show you some charts that summarize the material presented in the last two posts, and after that I’ll give you my takeaways. Here’s the SMI for all of the cameras simulated: There are two clear winners here, the XYZ response, and the optimized set of Gaussians. There are five losers: The Leica M8,… [Read More]
Visible noise and CFA filter spectra, part two
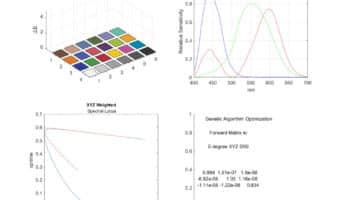
In the preceding post, I looked at the relationship between the spectra of several cameras color filter array mediated spectral response and the noise after the camera raw files are converted to colorimetric ones. In this post, we’ll look at some abstract responses. The first is 2-degree CIE 1931 XYZ: Top notch SMI, decent noise…. [Read More]
Visible noise and CFA filter spectra, part one
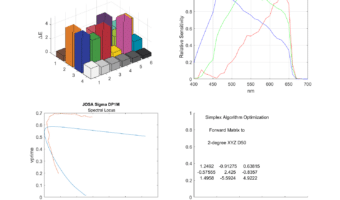
A few years ago, with help from Jack Hogan, I wrote a Matlab program that, given a set of color filter array spectra (to be technical, the spectra of the camera’s response to light passing through each of three color filters), would find the optimum compromise matrix for the Macbeth 24-patch Color Checker (CC24) and… [Read More]
Foveon Merrill color accuracy, continued
Yesterday I published a post that took a set of Sigma Foveon silicon spectral responses and a hot mirror spectral transmission spectrum, calculated an optimal compromise matrix, and evaluated the color accuracy of the camera using the Macbeth CC24 patch set for both training and evaluation. A reader questioned the accuracy of the curves supplied… [Read More]
- « Previous Page
- 1
- …
- 9
- 10
- 11
- 12
- 13
- …
- 385
- Next Page »
