A few years ago, with help from Jack Hogan, I wrote a Matlab program that, given a set of color filter array spectra (to be technical, the spectra of the camera’s response to light passing through each of three color filters), would find the optimum compromise matrix for the Macbeth 24-patch Color Checker (CC24) and calculate the ISO 17321 sensitivity metamerism index, or SMI. WHen I was doing the work, a question kept bothering me: why are the color filter array responses of consumer cameras so far away from what is optimal for accurate color capture? Was it that more accurate filters would be noisier? Are the proper dyes unavailable? Is there some other reason? I didn’t have the time or energy to pursue these questions, but I am taking baby steps towards doing that now.
It seems to be possible to create color filter array spectra that permit accurate color capture. As an existence proof, consider these devices:
https://ams.com/documents/20143/80162/TCS3430_FS000201_1-00.pdf
https://www.mouser.com/new/texas-instruments/ti-opt4048-color-sensor/
And the following filter set:
https://www.chroma.com/products/colorimetry/tristimulus-filters
The last set of filters provides close to two-degree 1931 CIE XYZ responses, with minimal insertion loss — the peak transmission of each filter is close to unity. But those filters are very expensive — roughly $1700 for a 25mm diameter set of three. Are they expensive because the market is small, or are they expensive because making them involves precious materials, costly machinery, or extensive labor? I don’t know. If the filters use interference techniques they may not be usable in camera CFA’s.
Setting aside the issue of feasibility, which I am unequipped to deal with, would more accurate CFA spectra produce more visually noisy results? That’s something I can explore.
Let’s review my previous process and my methods, since any noise work will be based on them.
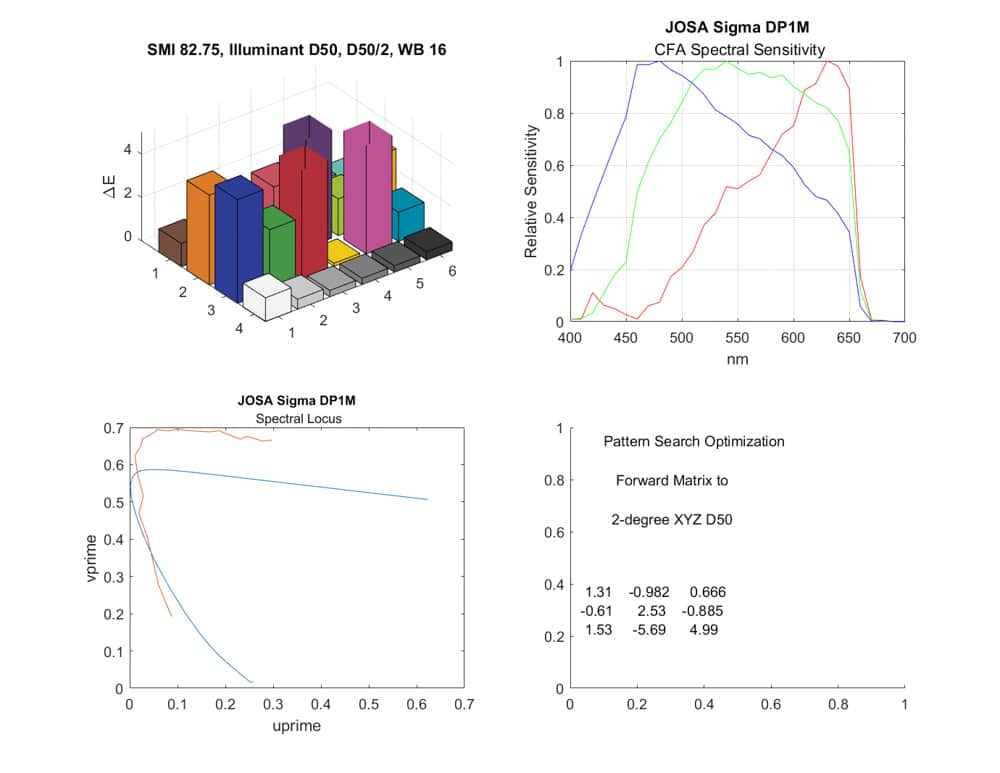
Here’s what the output looks like:
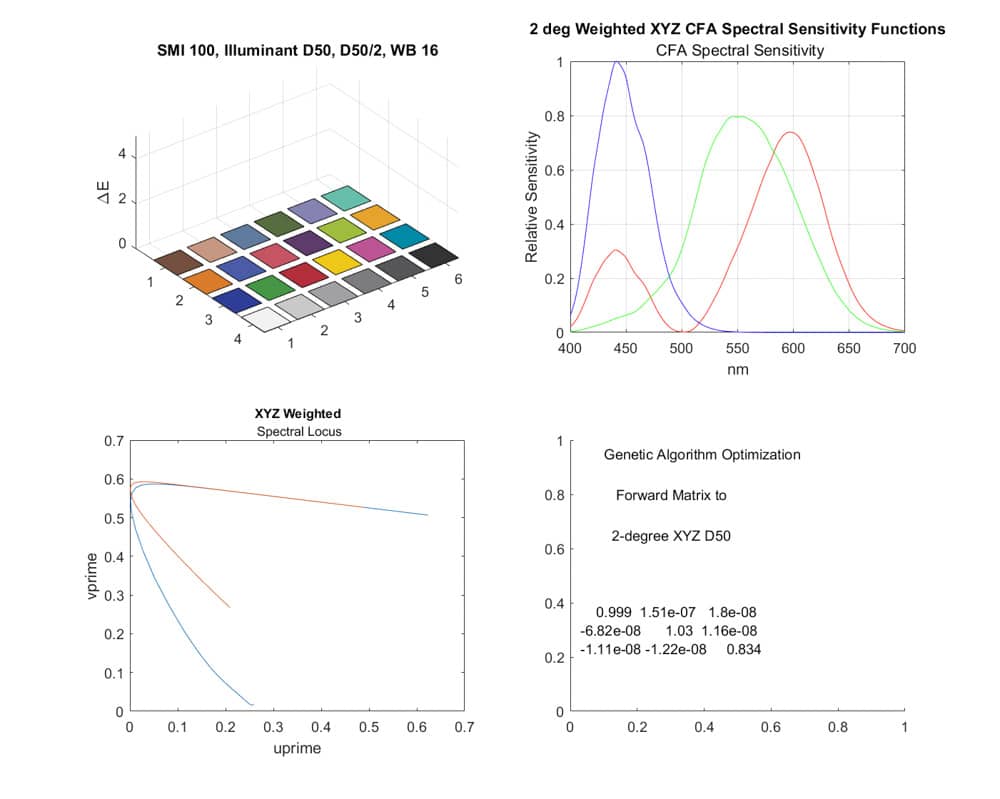
There are four plots here. The upper right one is the response of the three channels of the simulated camera. In this case, the simulated CFA is yielding the 2-degree 1931 standard observer XYZ response. The bottom right section shows the optimization algorithm used and the optimum compromise matrix found by that algorithm, considering the CC24 patches. You can see that it’s not far from the identity matrix. In a perfect world, it would be the identity matrix, which is a diagonal matrix with 0’s off-diagonal, and 1’s on-diagonal. The top left shows the error for each patch when that compromise matrix is employed, and the calculated SMI. The errors are all nearly zero, and the SMI is 100, which is perfect. I’m not sure about the utility of the bottom left plot. It shows the result of applying spectral (single wavelength) inputs to the sensor and passing the results through the compromise matrix. In a perfect world the red line would be right on top of the blue line.
You don’t need to have filter responses that look like the XYZ curves to have a high SMI. Here’s the best you can do with three Gaussian curves.
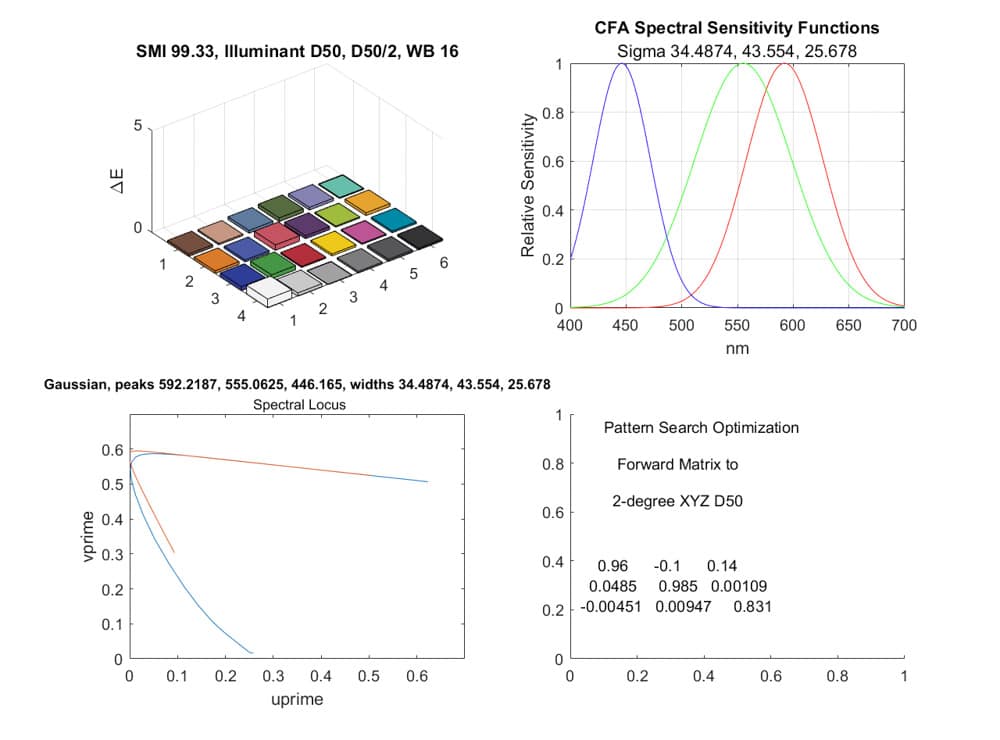
A look at these curves shows that one of the myths about CFA response is wrong. That myth is that, for accurate color, you want little overlap of the three channels (I’m looking at you, Phase One). In fact, you want a great deal of overlap, especially of the so-called red and green channels.
Now let’s look at a few cameras. Arri makes a big deal of their color accuracy, and it is warranted when compared to most other cameras, but it’s a far cry from the accuracy above:
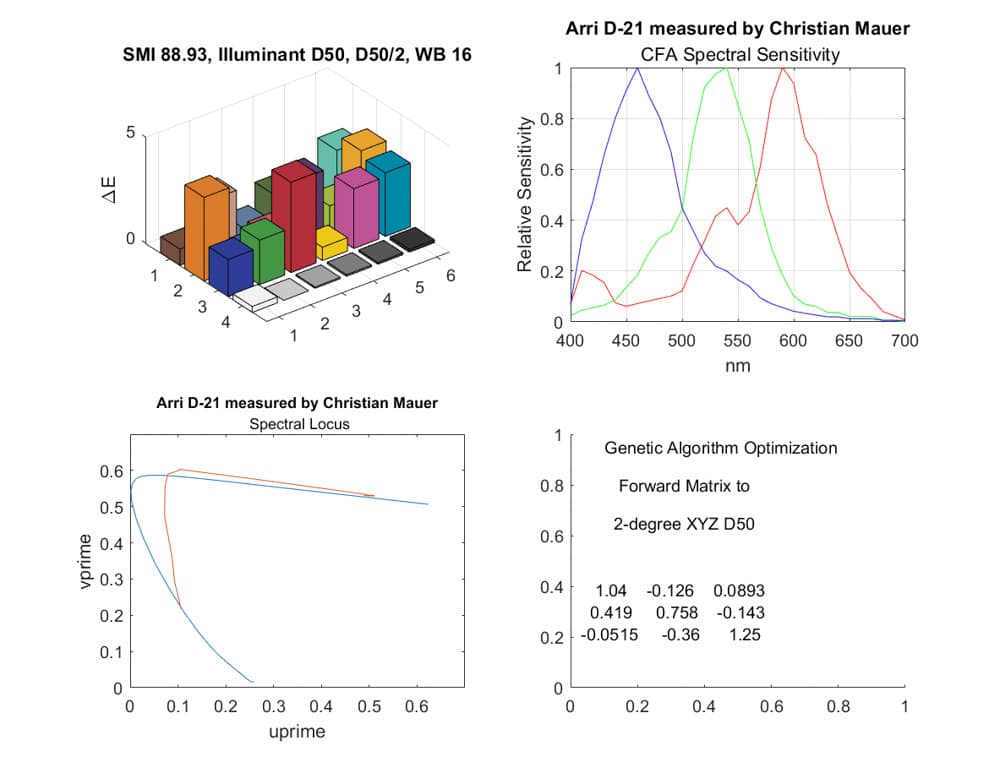
One of the issues is that the green and red channels are too widely separated.
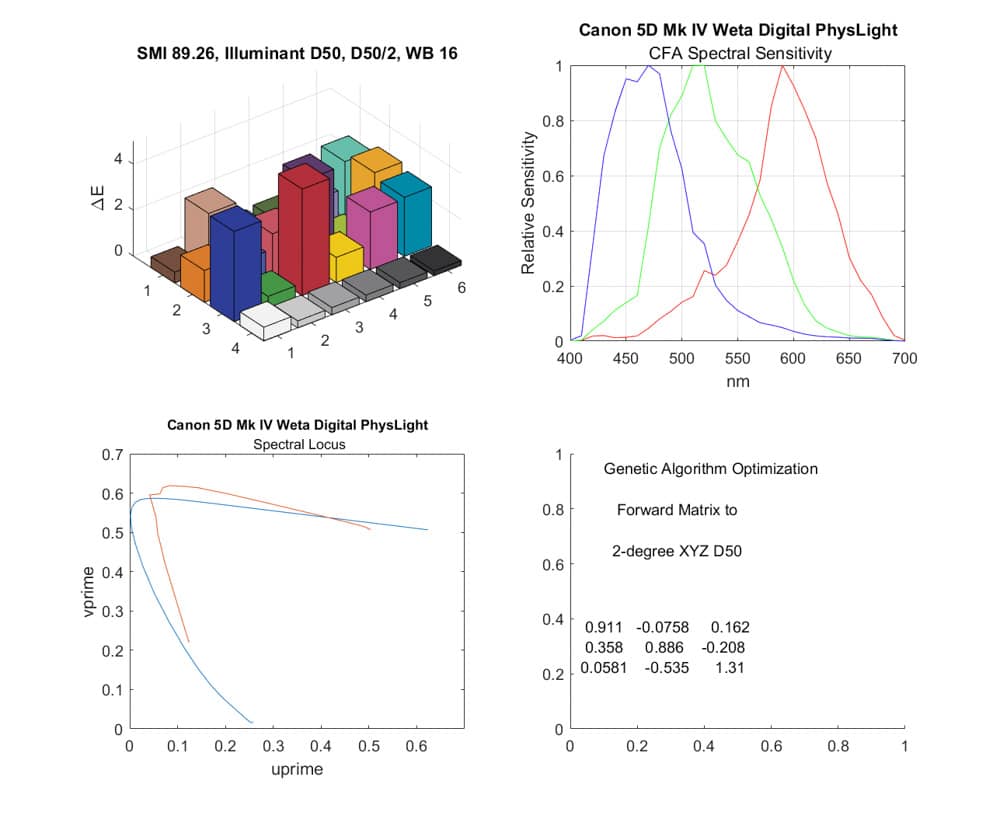
Canon also produces relatively good results; in fact, a bit better than Arri:
But Sigma’s Foveon Merrill results, in spite of the manufacturer’s touting of color accuracy, is mediocre:
Now we’ll look at some noise measurements. I assumed full ETTR exposure of one raw plane, so the attenuation of the filters is out of the picture. The CC24 is five stops underexposed. I set the full well capacity to 75,000 electrons in all cases and the RMS read noise to 11.5 electrons in all cases, so we’re just looking at the effects of the color filter arrays.
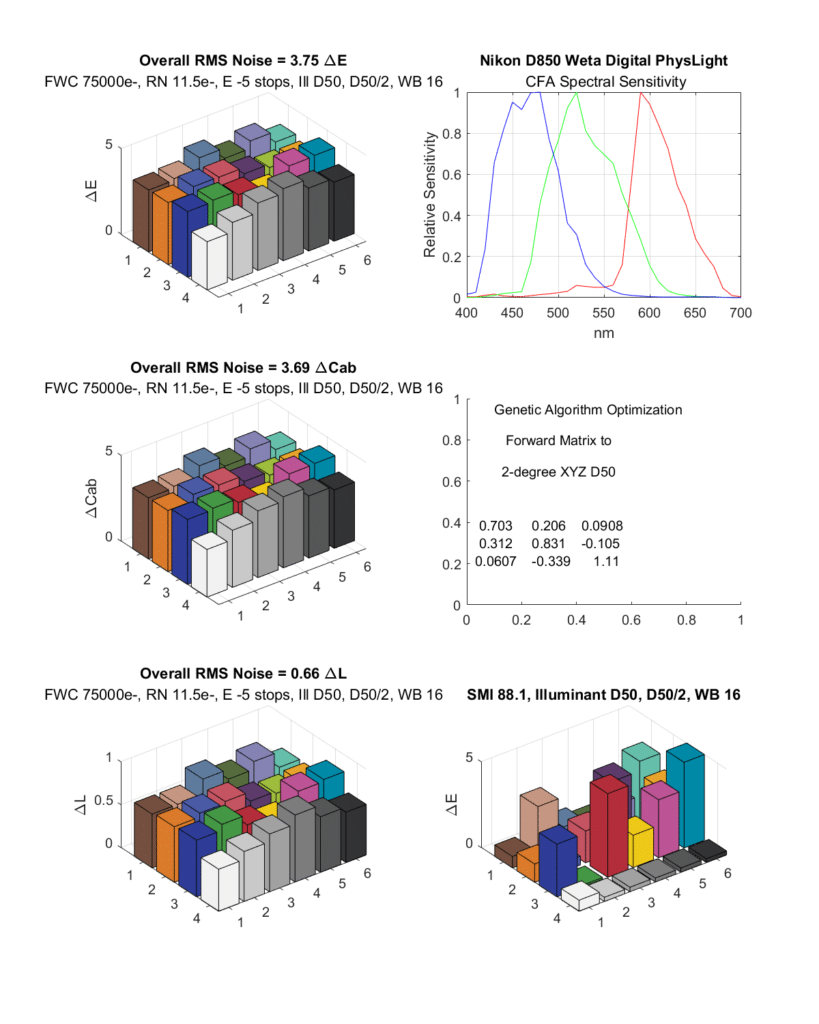
The D850 has an SMI of 88, which is pretty good, but not wonderful. The RMS noise is plotted in the left hand column. The top row measures total noise in CIELab Delta E. The next row down shows chromaticity noise in CIELab Delta Cab. And the last row shows luminance noise in CIELab Delta L. Most of the overall noise is luminance noise.
The D850 has a CMOS sensor. There are some — not me — who believe that CCD sensors yield better color. The Leica M8 has such a sensor:
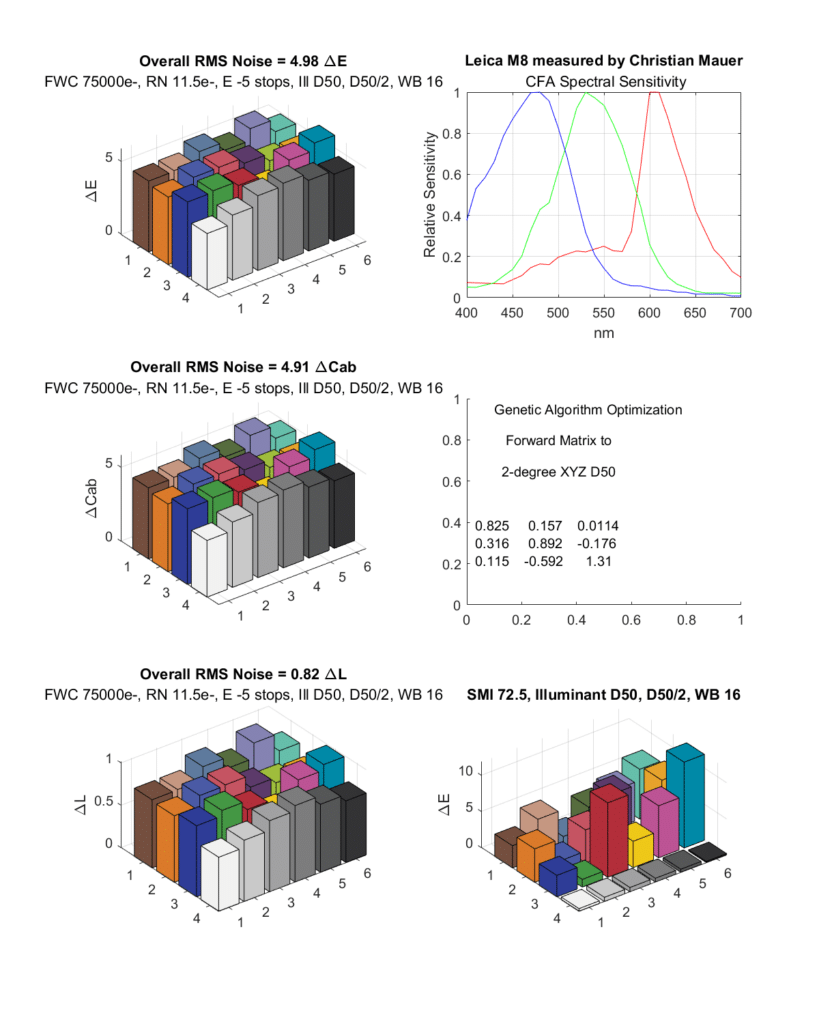
The SMI is quite a bit worse, and the noise is worse, too. The read noise is unrealistically low for a CCD sensor, but I left the read noise the same for all the simulations to isolate the effects of the CFA filter.
The Sigma Foveon DP1 Merrill is touted by its maker as having accurate color. But the images are noisy. Is part of that noise due to the color channel spectra?
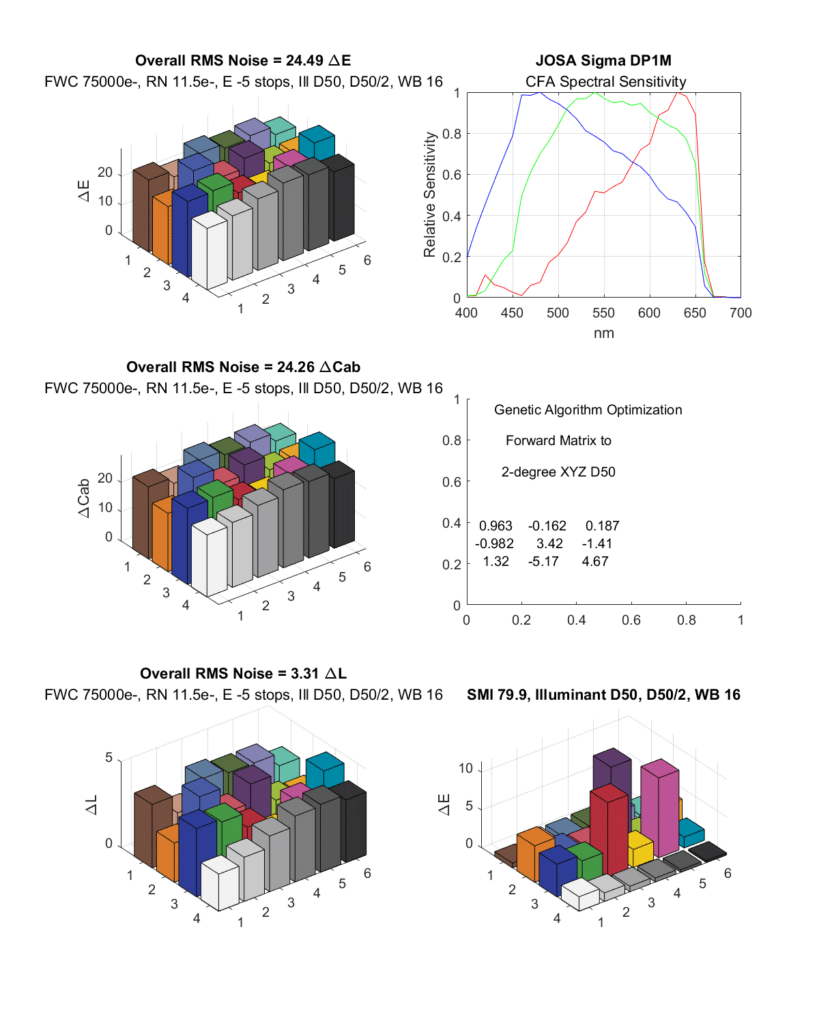
This is the worst of both worlds. Not only is the color accuracy low, the noise is very high, probably because of the cross terms in the compromise matrix. The real situation is even worse, since the DP1M has more read noise than I’ve used in this simulation, and the deeper channels suffer from attenuation of the signal.
Let’s look at another CCD camera:
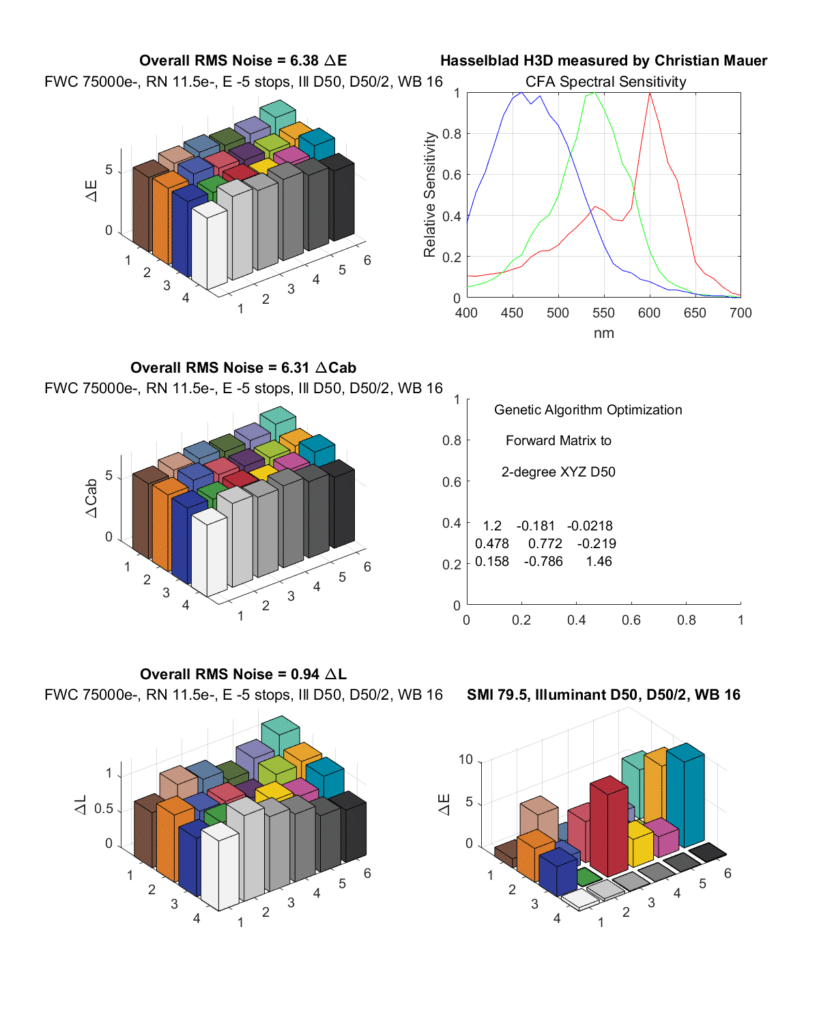
We have a combination of low SMI and moderately high noise. Reality is even worse, since the H3D has worse read noise than I used in the simulatiom/
Here’s a trio of Canon cameras:
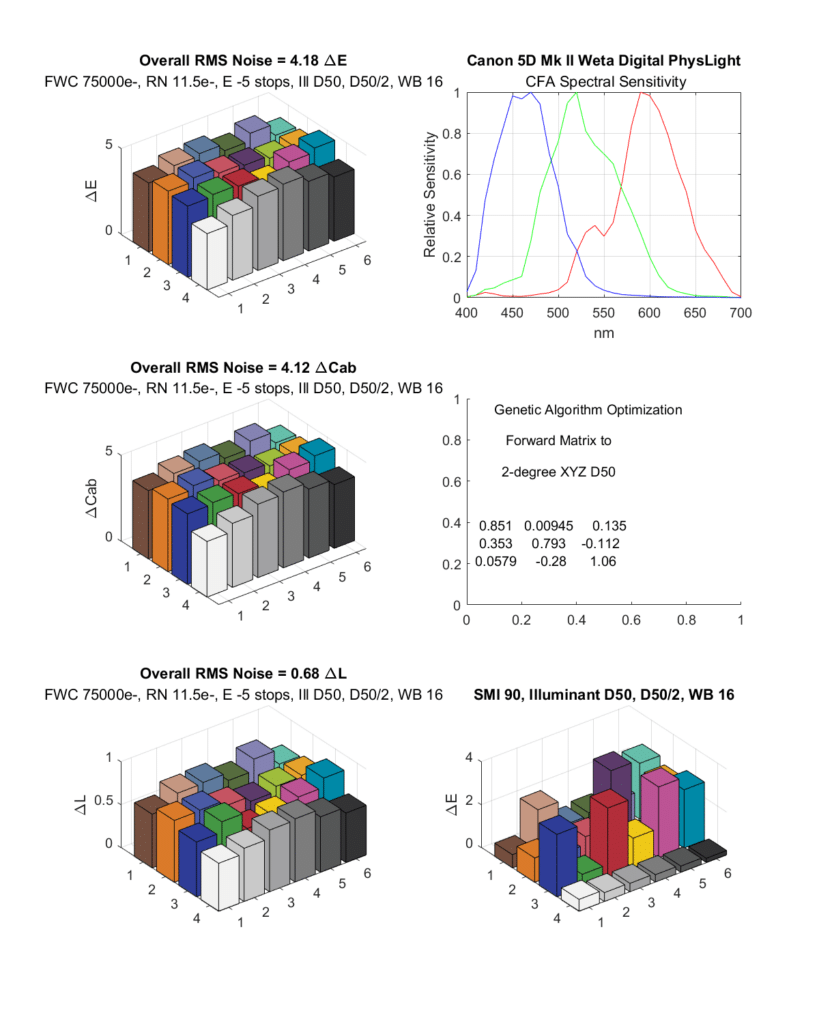
This one has guod SMI, and pretty good noise.
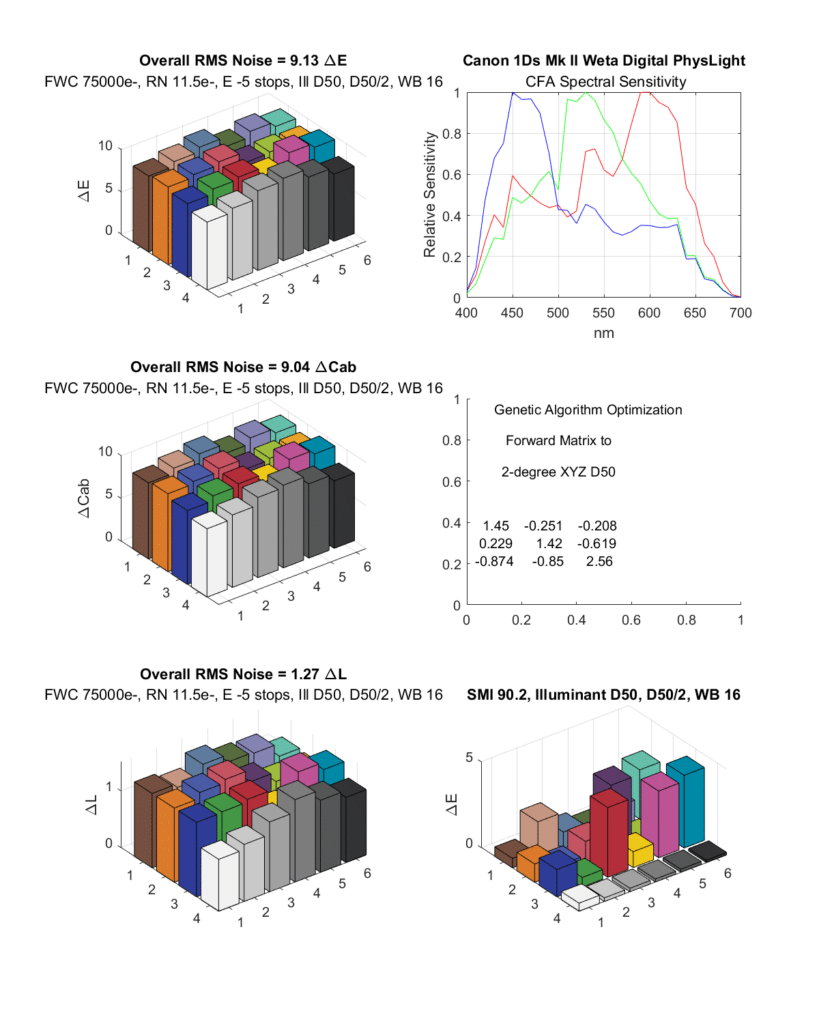
SMI is slightly better, but noise is much worse.
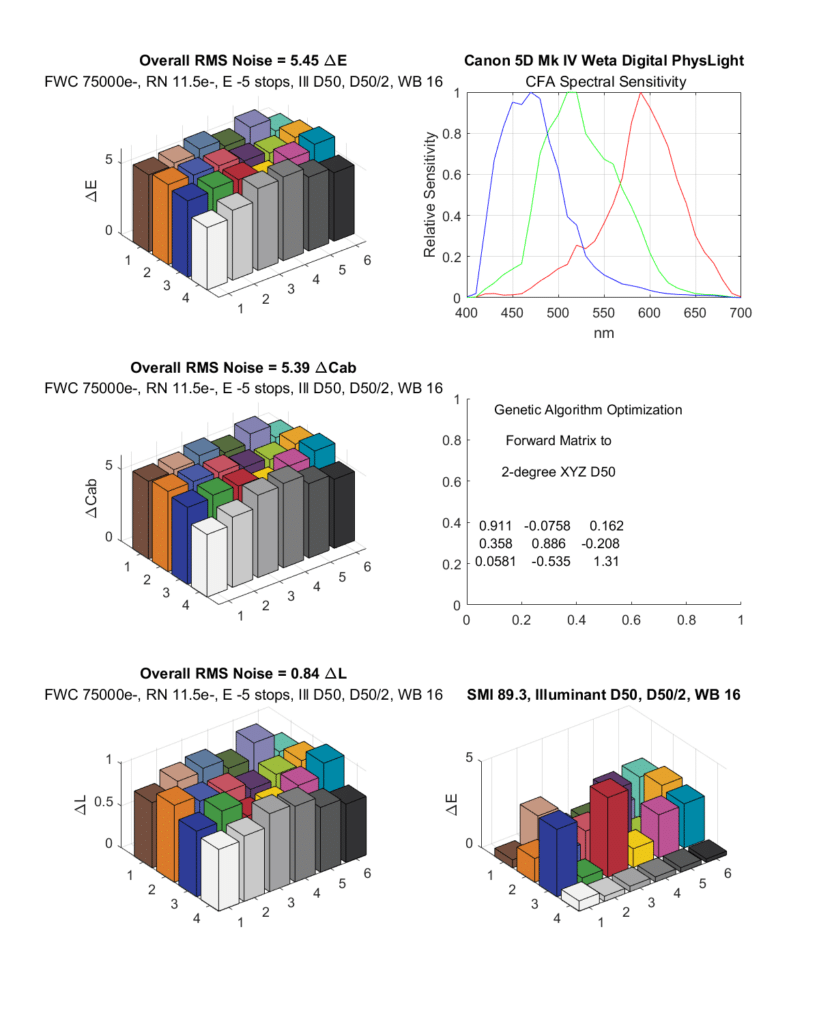
Decent SMI, Noise not too bad.
One more Nikon:
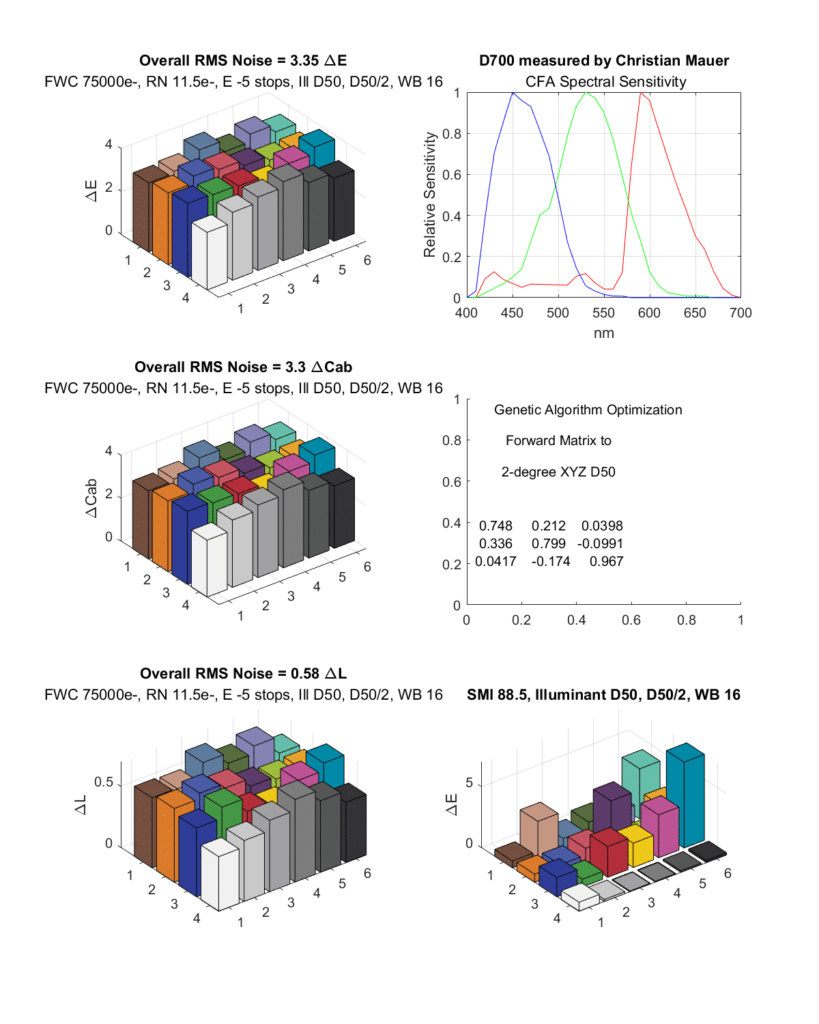
Pretty good SMI, very good noise.
In the next post, I’ll look at some CFA spectra that aren’t tied to any particular camera. In the one after that, I’ll present a summary.
Do you, by any chance, have CFA spectras from recent (100 and 150 MP) Phase One backs?
I don’t. Sorry.