A reader questioned the accuracy of the curves supplied to me. Fair enough, although the curves looked reasonable to me.
Iliah Borg, whom I greatly respect, send me a PDF of a paper from the Journal of the Optical Society of America (Maryam Mohammadzadeh Darrodi, Graham Finlayson, Teresa Goodman, and Michal Mackiewicz, Reference data set for camera spectral sensitivity estimation, JOSA Volume 32, Number 3, March 2015, pp 381-391), and an Excel spreadsheet with the curves.
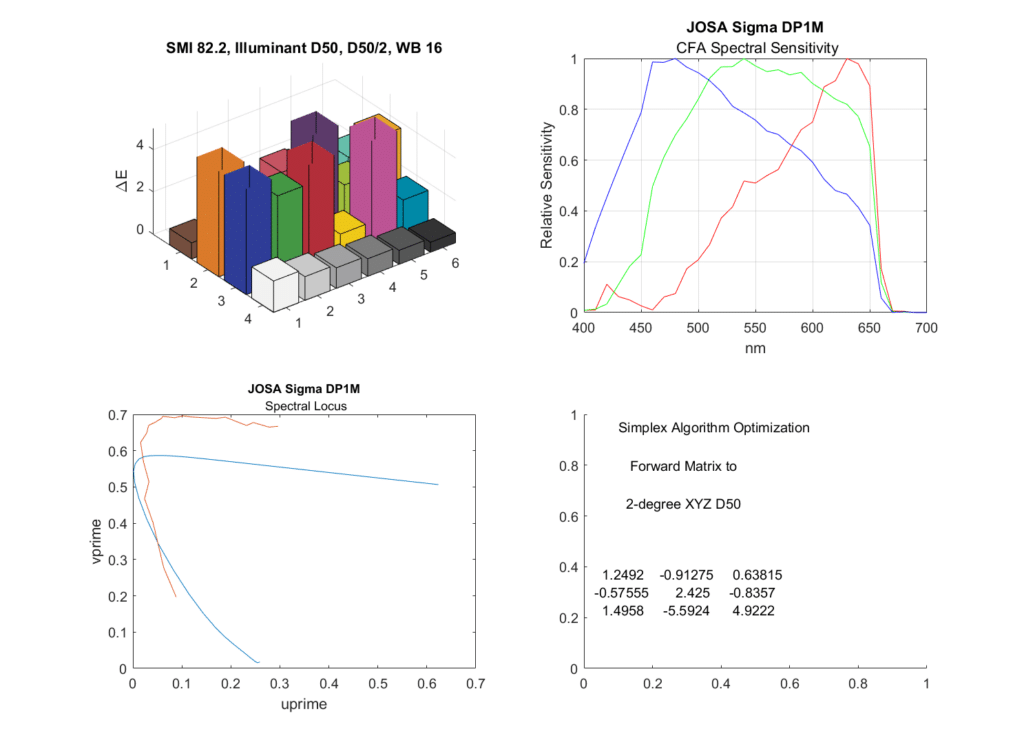
Here is the result with Simplex optimization:
Quite similar to the Spectral Metamerism Index I got with Ted’s data. 82.2, vs the 82 I got before.
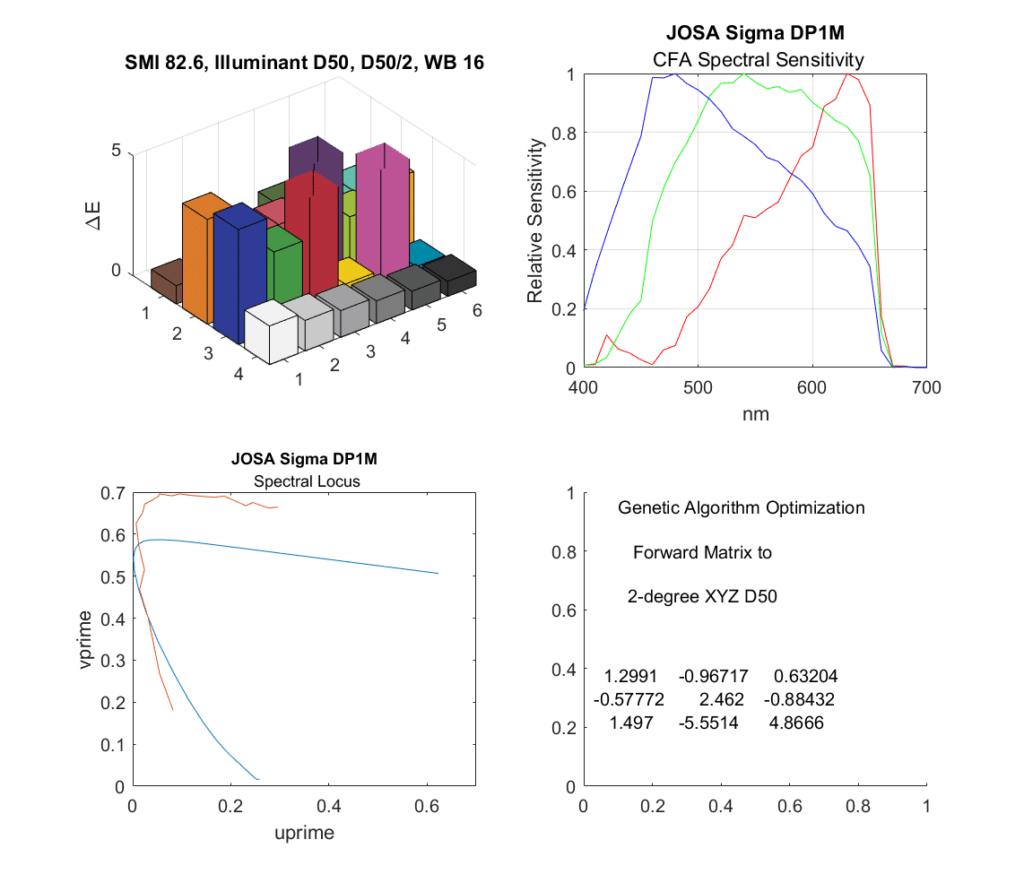
Here are the results using the genetic algorithm with a population of half a million.
The GA did a bit better than Simplex.
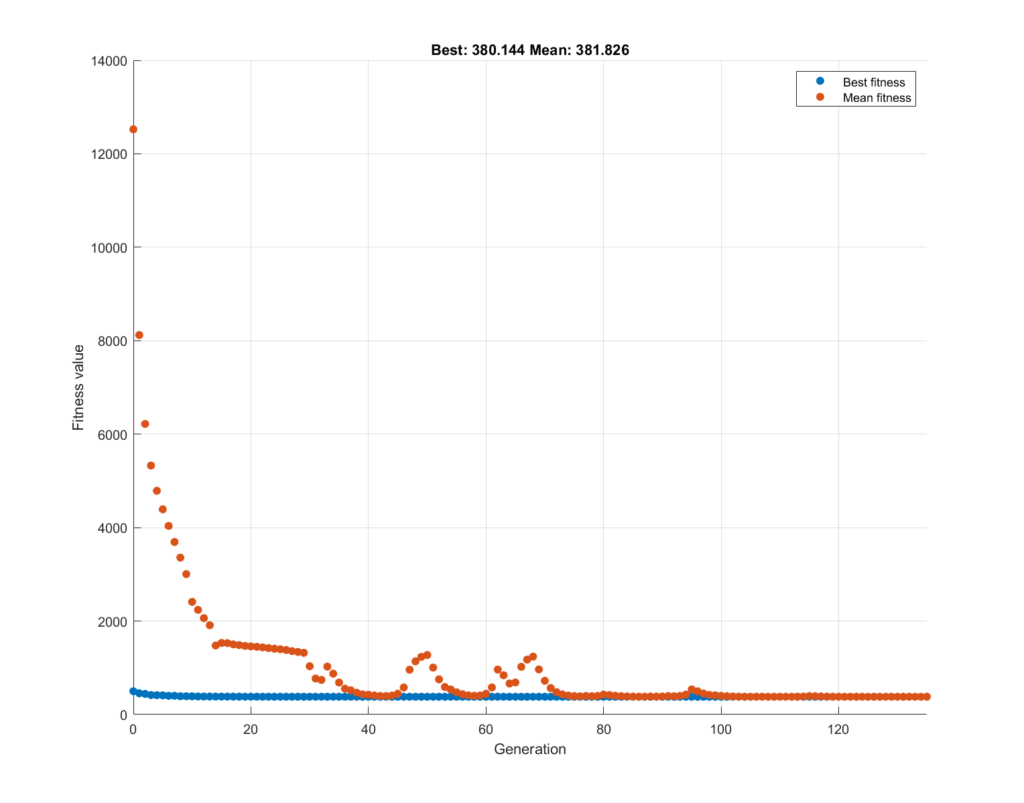
The GA converged fairly rapidly:
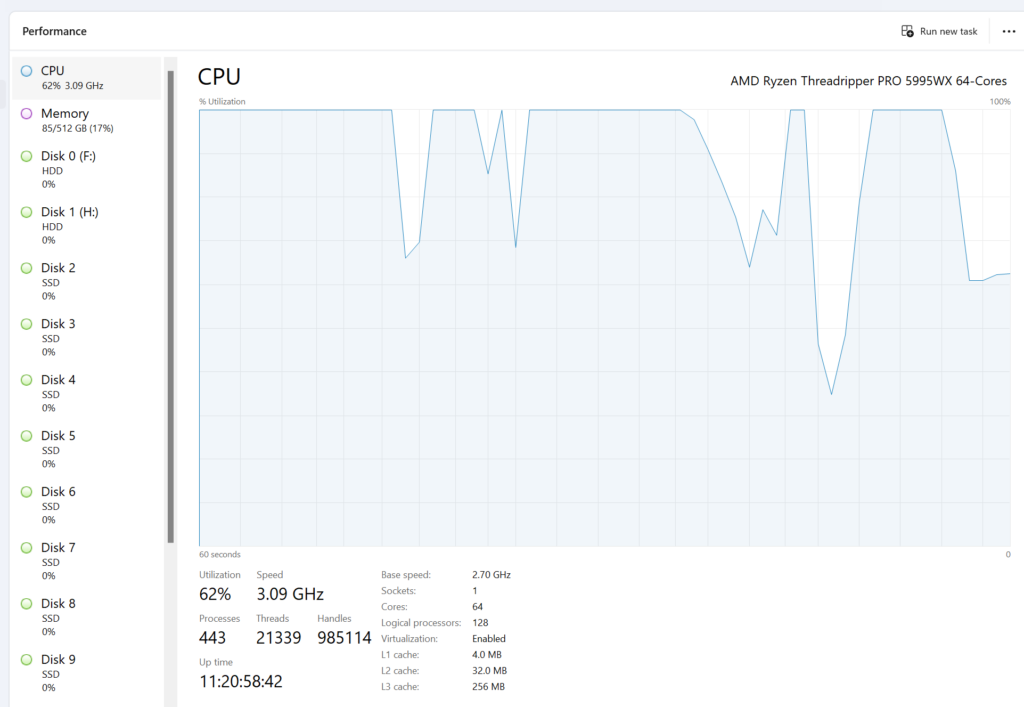
The GA eats a lot of computer cycles:


Dear Jim,
Thank you for your efforts in redoing graphs with another source of data. I respect you for that. I respectfully disagree that the xpat data and the Borg data are of similar quality. The MBCC bar representations betray their difference.
I looked and looked and could only find this. https://www.mdpi.com/2313-433X/2/2/14 Section 3.1 displays their spectral display for the SD1.
Thank you for your efforts.
Paul
In the paper you lined, the camera was modified by removing the IR filter:
> As noted, the internal near-infrared blocking filter was removed from the camera to enable full spectrum sensitivity