the last word

Photography meets digital computer technology. Photography wins -- most of the time.

  • site home
  • blog home
  • galleries
  • contact
  • underwater
  • the bleeding edge
You are here: Home / D850 / Do PDAF biases increase variability?

Do PDAF biases increase variability?

November 12, 2017 JimK 4 Comments

This is the 17th post in a series of Nikon D850 tests. The series starts here.

Horshack has made an argument that if there’s bias to a PDAF system (as far as I know, CDAF systems don’t have biases), that can make the focus variations look larger when compared to a system where the average of many PDAF attempts is correct.

Here’s my version of his reasoning. All credit to him, and if there are errors, they are mine.

Consider a PDAF system with no bias:

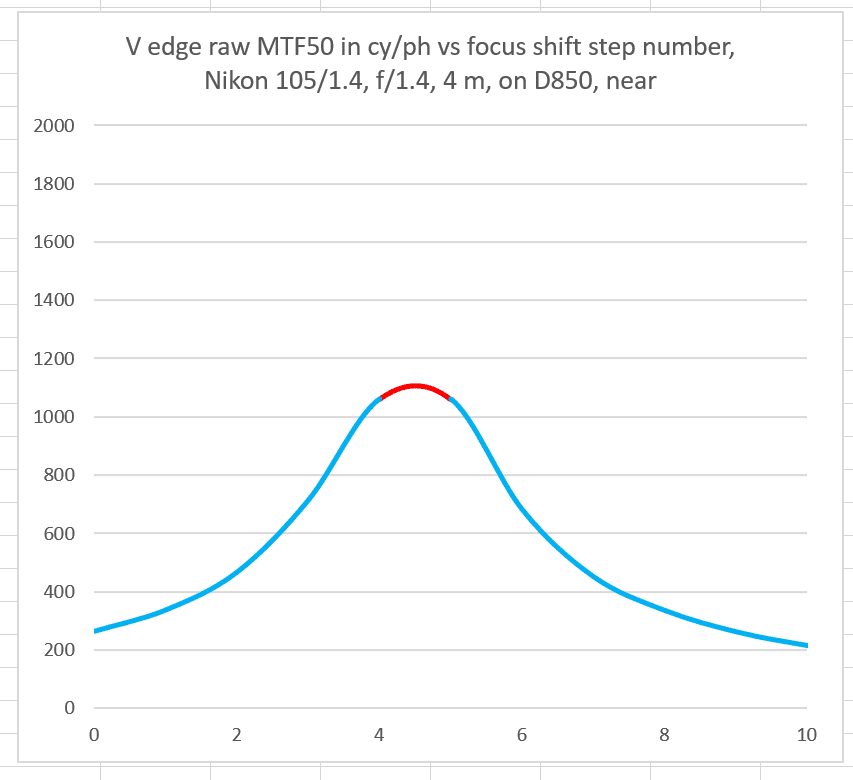
This is an actual raw-blue-channel MTF50 curve for the Nikon 58 mm f/1.4 wide open versus step number using the D850 Focus Shift Shooting feature with minimum step size. I’ve colored a part of the curve red. Think of a 1-step variation in focused distance, and see that the effect of the MTF50 numbers is not great.

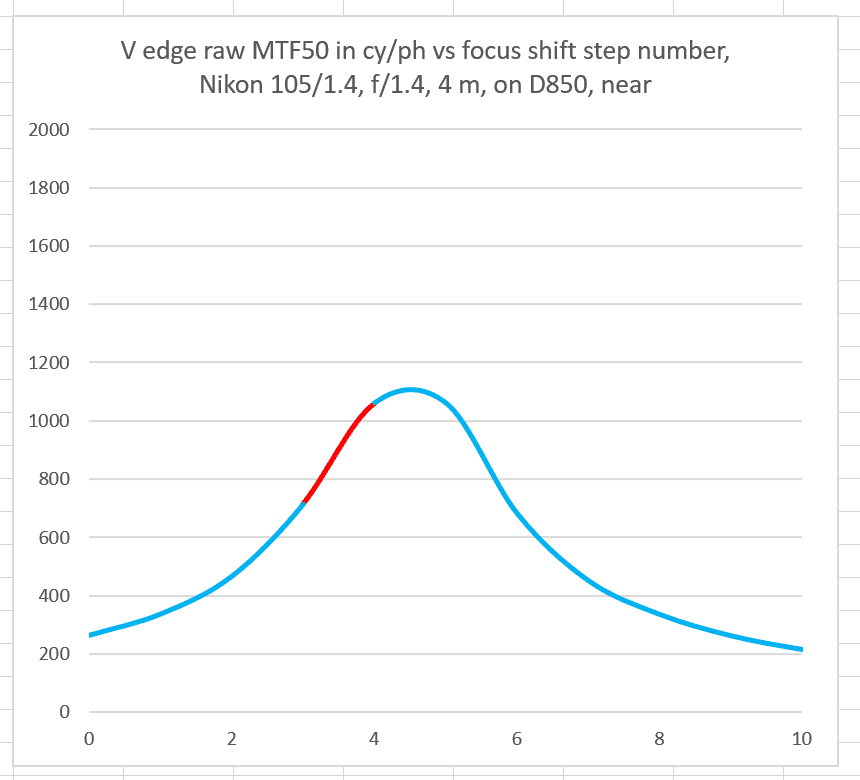
If there is the same one-step variation at a point that is offset from the peak, the variation in MTF50 is much greater.

The theory sounds good, but what about the practice? 

Consider these three plots from the immediately-previous post:


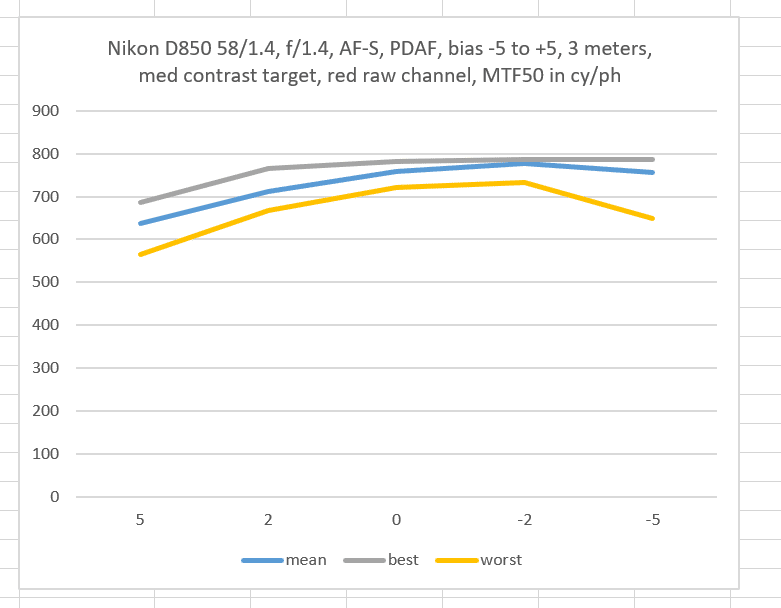
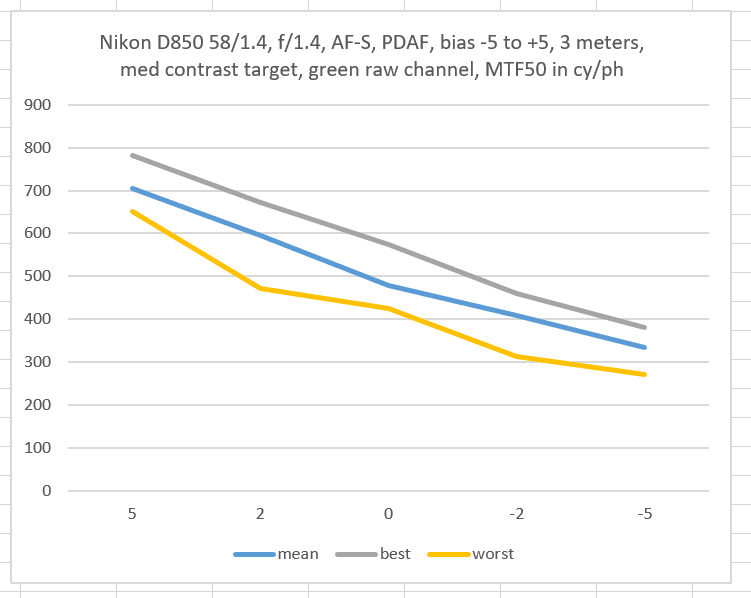
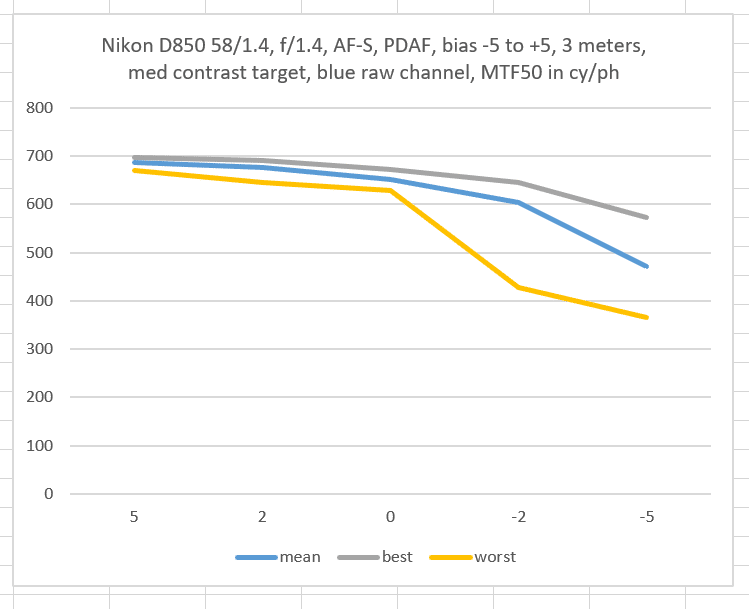
From the looks of the green curves, you’d expect that the standard deviation (sigma) would get larger as you proceeded from left to right.

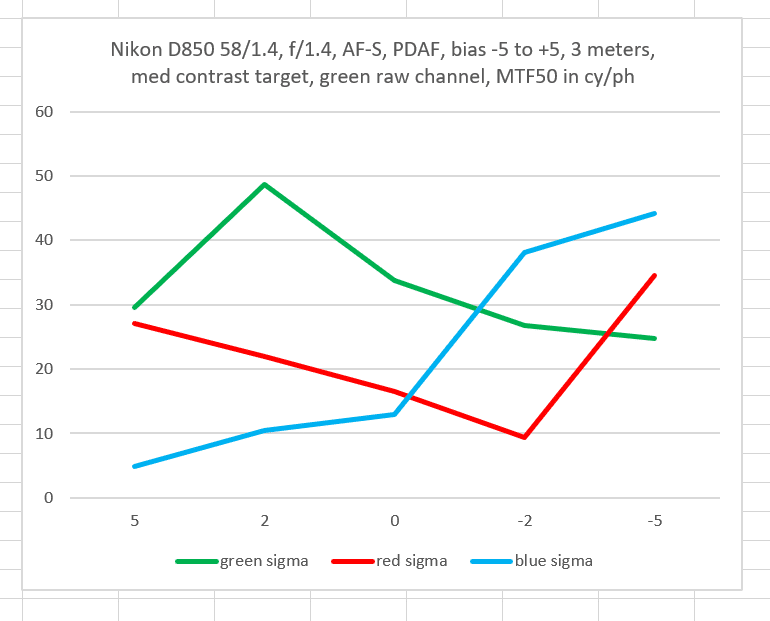
But you’d be mistaken.

My conclusion is not that the theory is wrong, but that we need a lot more samples to prove it right. And no, I’m not gonna redo the tests with 1000 exposures at each bias. I also suspect that there are uncontrolled systematic biases in the tests I’m doing, probably related to how far defocused the lens is between each capture. I don’t know of a good way to control this that doesn’t involve a lot of work.

D850

← Nikon D850 AF fine-tuning with the 58/1.4 D850 focus shift shooting with the Sigma 50/1.4 Art →

Comments

  1. Frans van den Bergh says

    November 12, 2017 at 10:15 pm

    How about measuring the frequency with which the PDAF system chooses a particular focus distance?

    Here is my thinking:
    1. You have the MTF50 vs distance curve for your lens (obtained using the focusing rail).
    2. You can take a measured MTF50 value, and use the inverse of the MTF50-vs-distance function to convert a measured MTF50 value into an approximate focus distance. The trouble is that the inverse is not a function, so you have to “rectify” the distance by using only the left half (relative to the peak) of the MTF50-vs-distance function’s inverse.
    3. Now take a bunch of images using the standard PDAF procedure (i.e., reset lens to close/far focus in alternating steps), and use the inverse function from step 2 to produce a histogram of distances (rectified) that the camera settled on. (we can leave the AF-bracketing out of this for now)

    This should directly reveal any bias in the PDAF system.

    Anyhow, I think I can see Horshack’s line of reasoning with regards to the bias, but in practice we have to take into account that the sensitivity of the PDAF system will be greater on the slopes (vs. the peak) of the MTF50-vs-distance function, so I would not expect a closed-loop PDAF system to “settle” on the slope.

    Reply
  2. Brandon Dube says

    November 12, 2017 at 10:47 pm

    Part of this is likely the failure of MTF-50. Consider tracking the MTF at, say, half nyquist (~60lp/mm for the D850?) vs focus instead. The results will probably be a lot more predictable.

    The SD of MTF-50 is not particularly meaningful either; the measurand changes between tests.

    Reply
  3. Horshack says

    November 13, 2017 at 11:17 am

    Thanks for doing this test Jim. I noticed the std. dev. increased markedly in the green channel between -5 and -2, owing to the “worst” sample, whereas the mean trend was constant through all the AFMA values. I’d be interested in seeing the underlying samples for the data. Could you post or email me the raw data for those? I’d love to see the 32 green-channel samples for each of the 5 AFMA values (-5, -2, 0, +2, +5), to get a better idea of the distribution.

    Reply
    • JimK says

      November 13, 2017 at 3:56 pm

      Check your e-mail. I just sent you the whole spreadsheet. Hope that’s not TMI.

      Reply

Leave a Reply Cancel reply

Your email address will not be published. Required fields are marked *

March 2023
S M T W T F S
 1234
567891011
12131415161718
19202122232425
262728293031  
« Jan    

Articles

  • About
    • Patents and papers about color
    • Who am I?
  • Good 35-70 MF lens
  • How to…
    • Backing up photographic images
    • How to change email providers
  • Lens screening testing
    • Equipment and Software
    • Examples
      • Bad and OK 200-600 at 600
      • Excellent 180-400 zoom
      • Fair 14-30mm zoom
      • Good 100-200 mm MF zoom
      • Good 100-400 zoom
      • Good 100mm lens on P1 P45+
      • Good 120mm MF lens
      • Good 18mm FF lens
      • Good 24-105 mm FF lens
      • Good 24-70 FF zoom
      • Good 35 mm FF lens
      • Good 60 mm lens on IQ3-100
      • Good 63 mm MF lens
      • Good 65 mm FF lens
      • Good 85 mm FF lens
      • Good and bad 25mm FF lenses
      • Good zoom at 24 mm
      • Marginal 18mm lens
      • Marginal 35mm FF lens
      • Mildly problematic 55 mm FF lens
      • OK 16-35mm zoom
      • OK 60mm lens on P1 P45+
      • OK Sony 600mm f/4
      • Pretty good 16-35 FF zoom
      • Pretty good 90mm FF lens
      • Problematic 400 mm FF lens
      • Tilted 20 mm f/1.8 FF lens
      • Tilted 30 mm MF lens
      • Tilted 50 mm FF lens
      • Two 15mm FF lenses
    • Found a problem – now what?
    • Goals for this test
    • Minimum target distances
      • MFT
      • APS-C
      • Full frame
      • Small medium format
    • Printable Siemens Star targets
    • Target size on sensor
      • MFT
      • APS-C
      • Full frame
      • Small medium format
    • Test instructions — postproduction
    • Test instructions — reading the images
    • Test instructions – capture
    • Theory of the test
    • What’s wrong with conventional lens screening?
  • Previsualization heresy
  • Privacy Policy
  • Recommended photographic web sites
  • Using in-camera histograms for ETTR
    • Acknowledgments
    • Why ETTR?
    • Normal in-camera histograms
    • Image processing for in-camera histograms
    • Making the in-camera histogram closely represent the raw histogram
    • Shortcuts to UniWB
    • Preparing for monitor-based UniWB
    • A one-step UniWB procedure
    • The math behind the one-step method
    • Iteration using Newton’s Method

Category List

Recent Comments

  • Mal Paso on Christmas tree light bokeh with the XCD 38V on the X2D
  • Sebastian on More on tilted adapters
  • JimK on On microlens size in the GFX 100 and GFX 50R/S
  • Kyle Krug on On microlens size in the GFX 100 and GFX 50R/S
  • JimK on Hasselblad X2D electronic shutter scan time
  • Jake on Hasselblad X2D electronic shutter scan time
  • Piotr Chylarecki on Who am I?
  • JimK on Who am I?
  • Piotr Chylarecki on Who am I?
  • Stefan on Swebo TC-1 OOBE

Archives

Copyright © 2023 · Daily Dish Pro On Genesis Framework · WordPress · Log in

Unless otherwise noted, all images copyright Jim Kasson.