This is the third in a series of posts on the Fuji GFX 100. The first one is here. Neither of these posts are actual tests of the camera, because I don’t have mine yet; my dealer expects it at the end of the month.
Yesterday, Bill Claff posted some analyses of a prototype GFX 100 on his excellent site, Photons to Photos. Your browser may complain when you click on that link, as I encourage you to do if you’ve not been there before (or even if you have), since Bill’s site does not yet support HTTPS, and browsers are getting progressively more picky about that. Don’t worry; Bill’s site is benign.
It is instructive to compare Bill’s numbers for three cameras:
- Fuji GFX 50S
- Fuji GFX 100
- Phase One IQ4 150
I threw the Phase One in there because it is the same generation BSI sensor from the same Sony sensor line, and has the same pixel pitch. It is therefore reasonable to assume that the pixel design is the same. That may be true, but there are some differences in Bill’s results from what you’d most expect if that were the case.
We’ll start with input-referred read noise. This is computed by measuring the full well capacity (FWC) and imputing the gain at each ISO from that. Then the read noise in counts is measured, and the effects of the gain at each ISO backed out to give the read noise in electrons at the pixel photodiode. Here’s a link to the chart below on Bill’s site (I did take the liberty of moving the legend to make the chart easier to read).
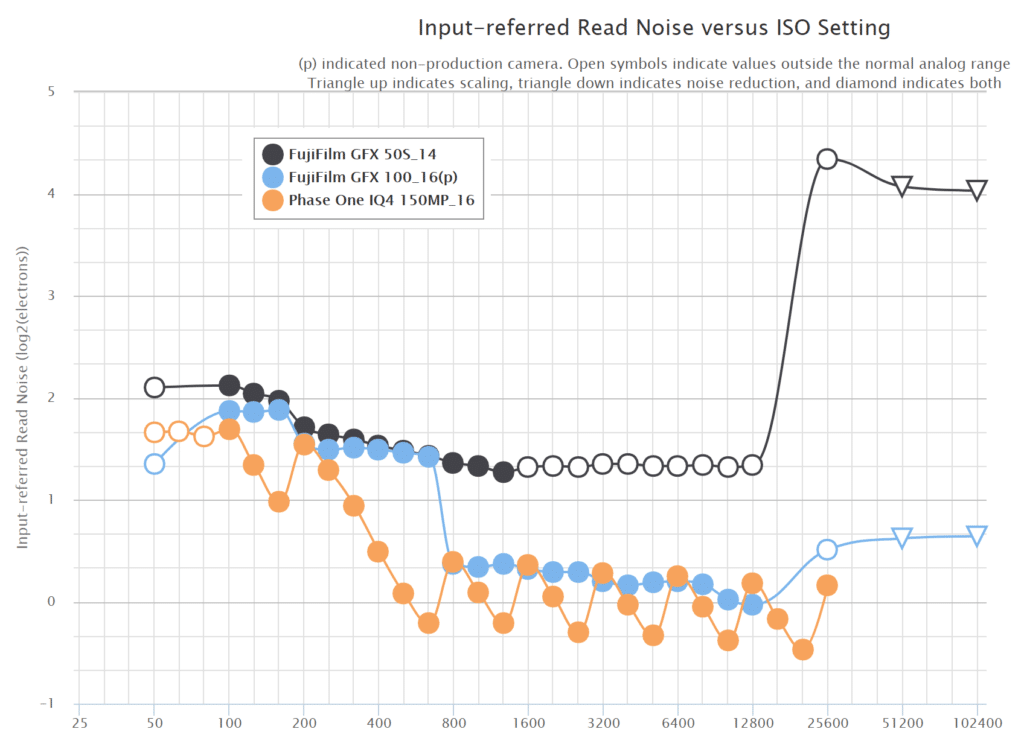
The read noise of the new Fuji camera (in blue) is slightly less than the GFX 50S at base ISO. This is better (and worse) than it seems. The read noise in electrons is done at a pixel level, and, since the new camera has more pixels, the effect in a same-sized print would be less even if the read noise were the same. But the full well capacity of the smaller photodiode in the GFX 100 is likely to be lower, making each electron of read noise more significant. Note the drop that occurs on the transition from ISO 640 to ISO 800. That is there result of changing the conversion gains at that point, almost certainly using the DR-Pix technology that Sony licensed from Aptina some years ago. It’s hard to say exactly what’s going on with the Phase One camera and DR-Pix, since the camera is not using straight analog gain at all the one-third-stop ISOs, but it looks to me like the conversion gain change is there, and kicks in on the transition from ISO 320 to ISO 400.
There’s another thing that can be learned from this chart, and I think it is bad news for Fuji GFX 100 users. Note the transition from the filled-in black dots to open ones that occurs as the ISO goes from 1250 to 1600 in the GFX 50S. At that point, the camera stops applying analog gain as the ISO knob is advanced, instead counting on the raw developer to compensate. At this point, the read noise is about as low as it’s gonna get, so there is no utility in further analog gain, and forgoing it gives added headroom in the files, a bright finder image (digital gain is applied to the JPEG file and/or the JPEG raw preview image), and no noise penalty.
A brilliant solution, I think, and one that is not often seen. But it’s missing from the GFX 100. That’s a disappointment.
Now let’s turn to Bill photographic dynamic range chart, which does take into account the sensor pixel dimensions. Here’s a link to the chart below.
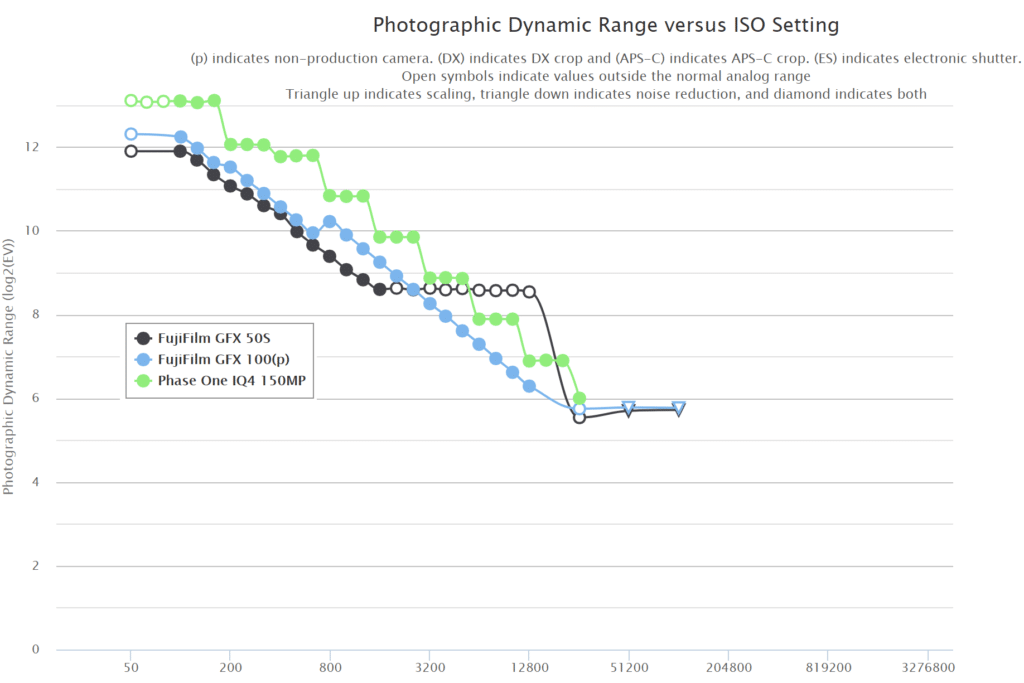
You can see that the GFX 100 is slightly better than the GFX 50s until ISO 800, where the conversion gain changes and it becomes significantly better. I would have expected better GFX 100 results at low ISOs.
[Added 6/6/19. I see that some people are looking at the PDR chart above and concluding that the GFX 50S sensor has an inherent advantage over the 100 at ISO 3200 and above. I want to emphasize what comes next: that is wrong. The open points on the GFX 50S PDR curve are the result of the fact that they come as a result (I was tempted to say side-effect, but they are indeed the desired effect) of the GFX 50S’s cessation of analog gains increases above ISO 1250. I wish the GFX 100 did that, too, probably starting at ISO 2500 or so. But this is not a fundamental sensor flaw, and it has an easy workaround: don’t use ISOs above 2500 or so on the GFX 100; just push in post when you need more gain. Unfortunately the workaround has the side effect of darkening the JPEG preview and EVF finder images from the desired result, since they don’t know about the intended push.]
Using the assumption that the pixel designs were the same, I earlier found the same-sized-print shadow noise of the GFX 100 would be closer to that of the IQ4 150 than the 50S. Bill has published photon transfer function curves for all three cameras (here’s the one for the GFX 100), and now I’ll analyse how the characteristics of the sensor combine to generate the PDR curves above.
If I’m generous with my assumptions about blackpoint, Bill’s PTCs for the GFX 100 put the FWC at 39500 electrons, as opposed to the 47000 electrons for the IQ4 150. If that proves to actually be the case upon further testing, then the sensor pixels are not of the same design. I’m scratching my head on this one. When I get the camera I’ll do my own FWC tests.
If we take a FWC of 39500 e- and Bill’s base-ISO read noise for the GFX 100 and plug them into my camera shadow noise simulator, it spits this out:

The Claff PDR limit is 3.3 (log2 of 10.0), and is plotted as a horizontal black line. Bill doesn’t get the PDR of the IQ4 150 quite as high as the simulation, and I used his implied FWC for that camera, too, so maybe his IQ4 FWC is a bit high and that for the GFX 100 is a bit low.
If we go with Bill’s read noise measurements, and increase the FWC of the GFX 100 to 47000 electrons, here’s what happens:
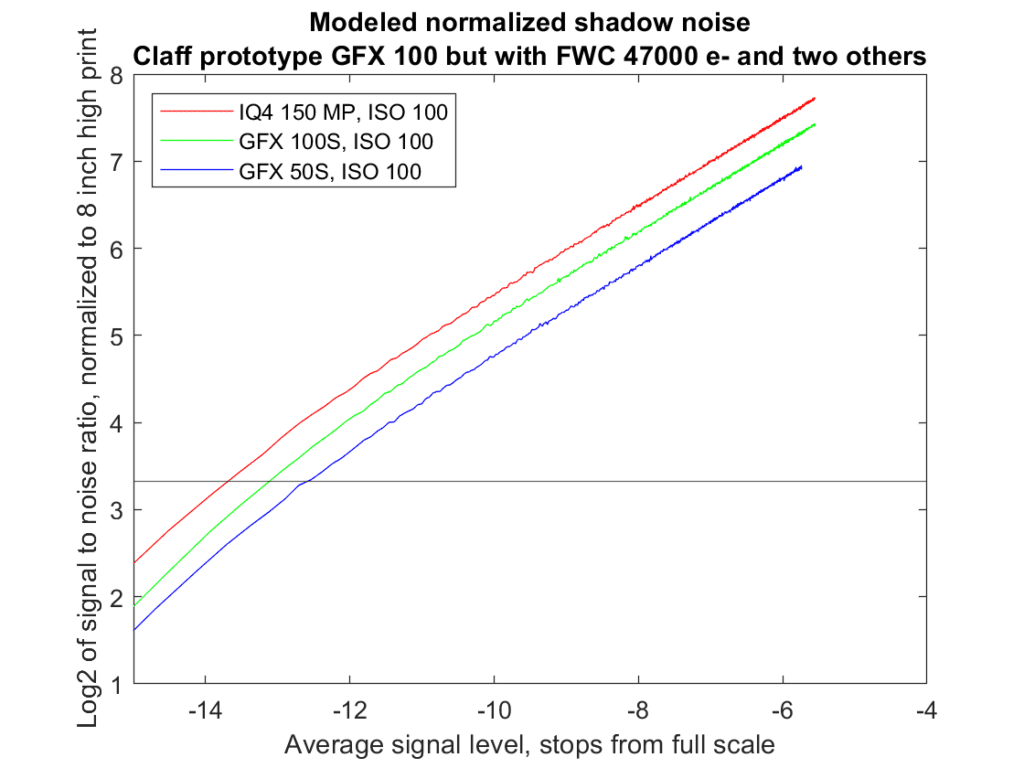
I’m hoping that, when the smoke clears, that’s closer to reality. It’s early days. Time will tell.
If we increase the ISO settings to 800 and leave the FWC at 47000 electrons, we get this:
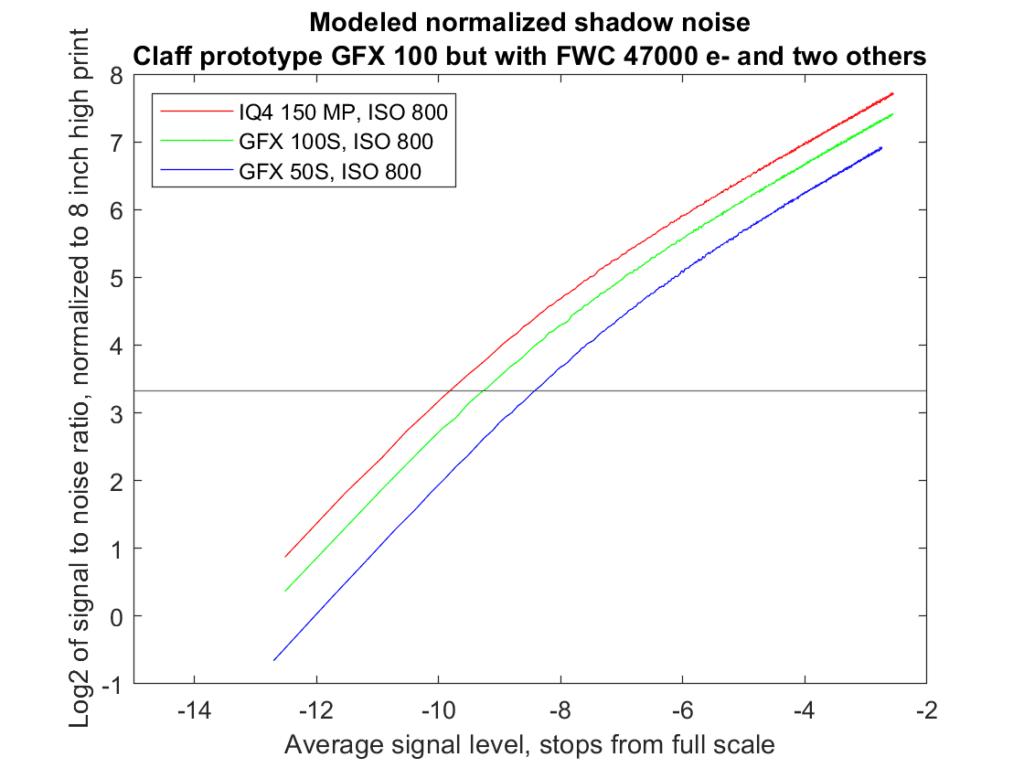
That shows the GFX 100 as a significant step upwards in dynamic range.
Does the 150mp sensor have PD pixels? Phase appear to use an off sensor chip for AF. We know the 100mp sensor in the Fuji has PD pixels. Would that make a difference to the FWC if so?
You mean with the Phase One toppings? I think not; it was designed for a DSLR.
I meant Phase Detect pixels that the Fuji will use on the 100mp sensor for AF while the 150mp sensor, as you say is for a DSLR and Phase have a separate AF system. I know the PD pixels introduce striping, not sure if that might have an affect on PWC (for eg does it reduce the effective area of the pixel by a small amount?).
So did I.
You mean an effect on the FWC? It’s certainly possible if there are changes made to the underlying silicon to better support them. But the FWC that Bill is computing come from averages of many pixels, not just the PDAF ones, so their effect on Bill’s computation of Kadc, which I used to get FWC, would be diluted.