I made test shots of both the Macbeth Colorchecker 24-patch target (the CC24), and the Colorchecker SG 140-patch target (CCSG). I used the following setup:
- Sony a7RIV, Nikon Z7, Fujifilm GFX 100
- Zony 55, Nikon 24-70/2.8 Z-mount lens, Fuji 120 mm f/4 macro
- Godox/Flashpoint AD600 Pro strobes, set to 1/64 power.
- 12-inch reflectors
- 45-degree strobe angle
- Base ISO
- f/11 – f/16
- Foba camera stand
- Arca Swiss C1
I used the same setup to capture white card images for flat fielding.
I made profiles for all the cameras using both targets and
- X-Rite Color Checker Camera Calibration
- Lumariver Profile Designer, reproduction mode, 2.5 D tables, flat fielded
I took images of the CC24 made with both cameras and exported them from Lightroom, after white balancing to the third grey patch from the left, with these profiles:
- Adobe Color Profile (ACP)
- Adobe Standard Profile (ASP)
- The Lumariver reproduction profile made with the CCSG target (CCSG Repro)
- The Lumariver reproduction profile made with the CC24 target (CC24 Repro)
- The X-Rite Color Checker Camera Calibration profile made with the CC24 target (CCCC 24)
- The X-Rite Color Checker Camera Calibration profile made with the CCSG target (CCCC SG)
I ran my Matlab CC24 color analyser program on all 18 images (6 from each camera). Here’s what I got for average CIELab Delta-E 2000 errors:
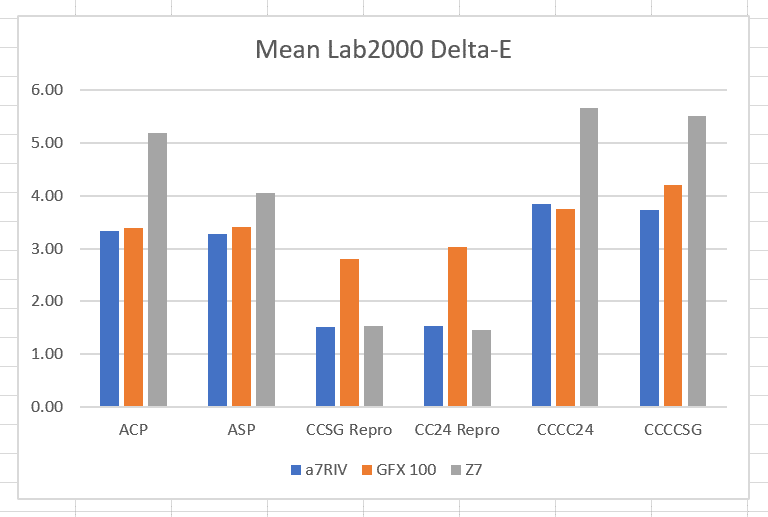
I expected that the profiles that were the most accurate with the Lumariver reproduction profiles would be the most accurate with the others. That is not the case: the Z7 — by a whisker — is the most accurate with the Lumariver profiles, but the least accurate with the others.
I expected the reproduction profiles to be distinctly more accurate than the other profiles. in all cases. That didn’t happen in the case of the GXF 100, where the reproduction profiles were a small improvement in accuracy over ACP and ASP.
Here’s the same graph for the rms error, which penalizes outliers more:
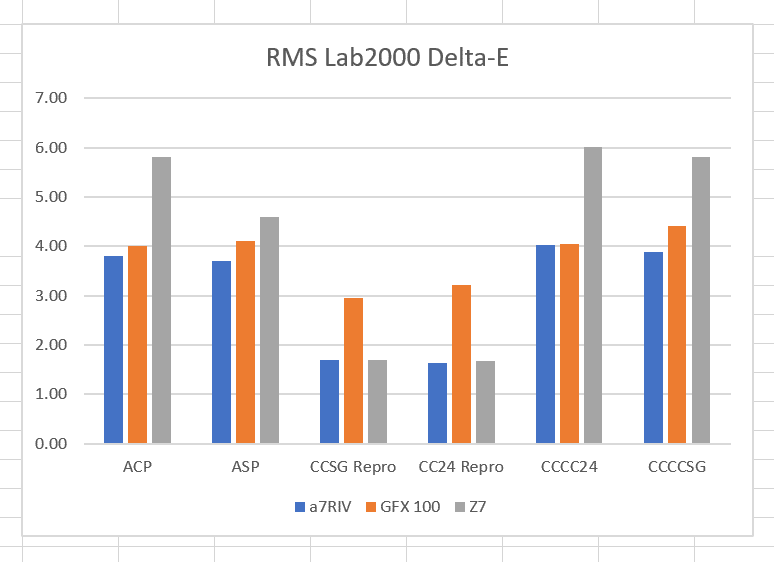
The results are quite similar.
Looking at the chroma of the non-gray patches, we see big differences among the profiles, but small differences among the cameras.
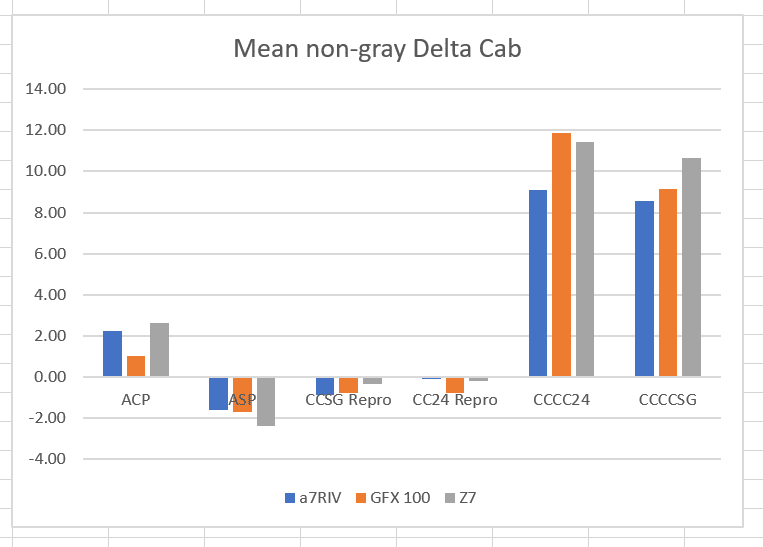
It appears that the reproduction profiles are trying to reproduce chroma accurately, while the X-Rite profile makers want to amp things up as much as they can without making the delta-E errors too big.
For you color geeks, here are the complete analysis statistics for each camera:
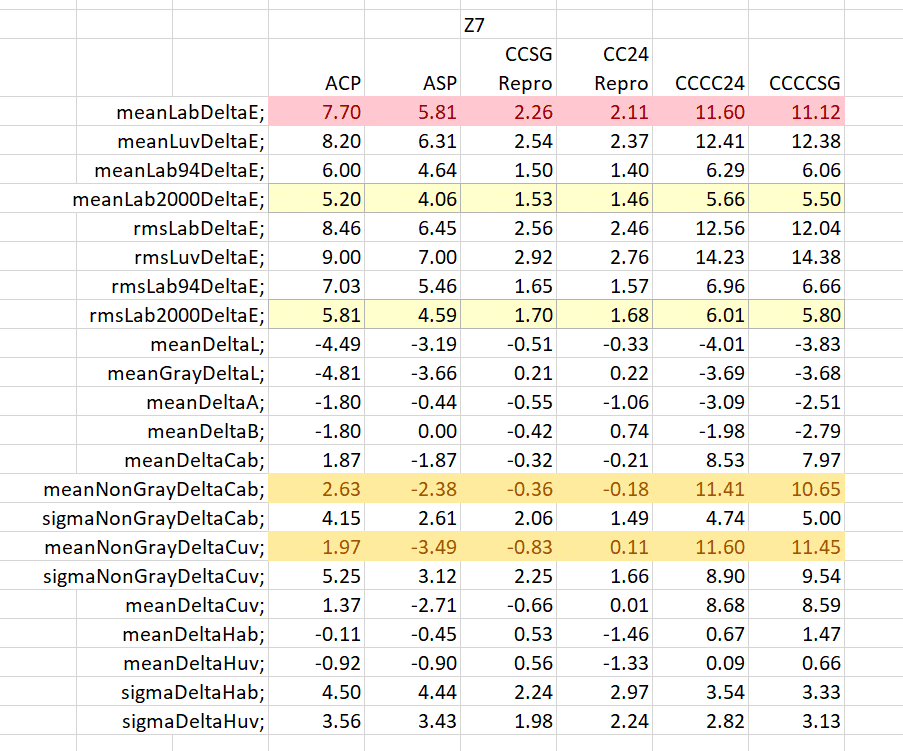
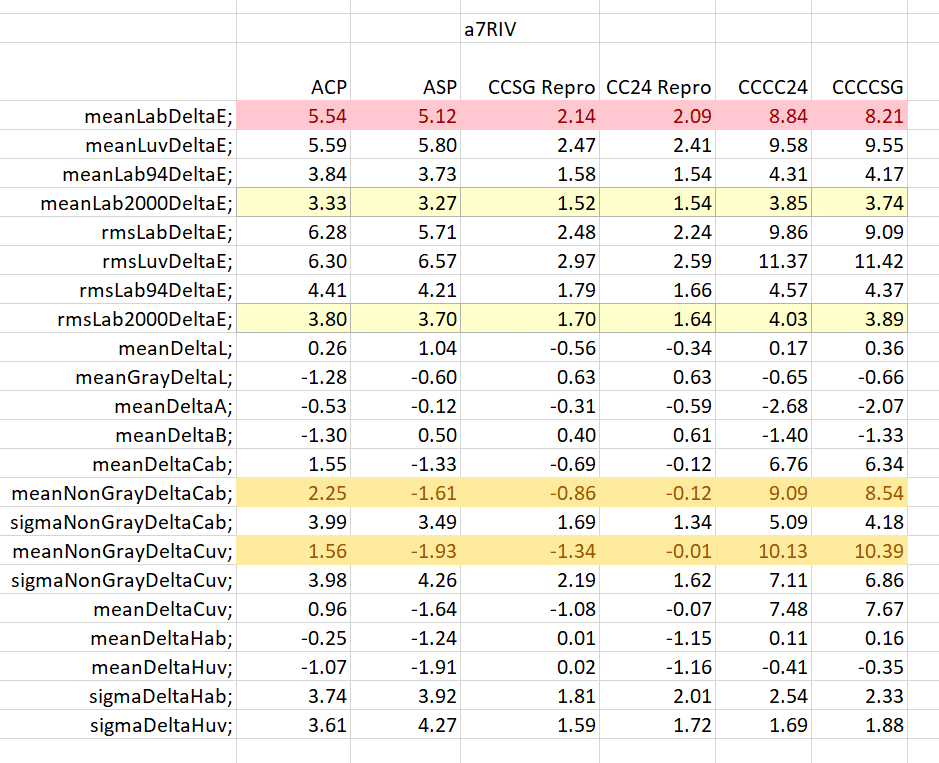

Here’s what the rows mean:
Mean Delta E is the average CIELab delta E. Since Delta E can never be negative, errors in one direction don’t cancel out errors in another.
Mean Delta L is the average difference in the CIELab and CIELuv vertical (luminance) channel. Positive Delta L means that the output is brighter than it should be. Negative Delta L means that the output is darker than it should be. Thus Delta L is good for detecting systematic luminance bias.
Mean Gray Delta L is the average difference in the CIELab and CIELuv vertical (luminance) channel for the 6 gray patches. Positive Gray Delta L means that the output is brighter than it should be. Negative Gray Delta L means that the output is darker than it should be. Thus Gray Delta L is good for detecting systematic luminance bias in the gray axis.
Mean Delta A and B are the average differences in the CIELab and CIELuv a and b channels. Positive Delta A or B means that the output is redder or yellower than it should be. Negative Delta A or B means that the output is bluer or more cyan than it should be. These measures are good for detecting systematic color balance bias.
Mean Delta Cab is the average chroma error measured in Lab. A positive number means that the output colors are more saturated than they should be. A negative number means that the output colors are less saturated than they should be.
Mean Non-Gray Delta Cab is the average chroma error measured in Lab for the 18 chromatic patches. Mean Non-Gray Delta Cuv is the average chroma error measured in CIELuv for the 18 chromatic patches. A positive number means that the output colors are more saturated than they should be. A negative number means that the output colors are less saturated than they should be. The sigma metrics track the standard deviation of the 18 samples.
Mean Delta Hab is the average hue angle error measured in Lab, expressed in degrees. The gray patches are excluded from this measure, since their target hue angle is undefined. A positive number means that the output colors have a hue angle higher than they should have. A negative number means that the output colors have a hue angle lower than they should have. Mean Delta Huv is the same measure in CIELuv. The sigma metrics track the standard deviation of the 18 samples.
Erik Kaffehr says
Thanks for sharing!
My understanding is that you didn’t include LumaRiver with ACR curve in this comparison. The impression I have from your previous testing that LumaRiver also pushes chroma when used with a tone curve.
On the other hand, it may seem that the Adobe profiles combine pretty accurate color with ACR tone curve, without pushing chroma.
So, LumaRiver may be the best choice for accurate reproduction, but Adobe profiles may be a better choice with a tone curve?
I am very glad you are doing this evaluations. Unfortunately you may spend the rest of your, hopefully long and healthy, life looking at this stuff.
It would be interesting to see what benefits illumination specific profiles bring compared to simple dual illuminant profiles, just as an example.
Best regards
Erik
JimK says
I’m working in that direction. I still don’t have a way to read illumination spectra with the i1Pro3. I also don’t have a good approximation of an Illuminant A light. It would be easy to make a dual-illuminant profile with the Westcott LED panels, but that wouldn’t be the same.
I also want to try raw flat-fielding with RawDigger.
Jack Hogan says
” I still don’t have a way to read illumination spectra with the i1Pro3.”
With the i1Studio/Munki you can use Argyll CMS spotread or similar to measure the illuminant since you can switch in a diffuser. I think you should be able to do that with the i1Pro, perhaps with an external diffuser. If Argyll, use the 3.3nm high-res mode.
Erik Kaffehr says
Hi Jim,
Anders Torger suggest using a Solux bulb at overvoltage for D50. I also used a normal halogen bulb for illuminant A.
For the Solux I used 14.5 V for D50
For the normal halogen 10.1 V for Illuminant A (2850 K).
Your Seconic shows color temperature.
Best regards
Erik
Jack Hogan says
Jim, the fact that the GFX100 is not as good as the others with the Repro profiles suggests that it has challenging CFA spectral sensitivity functions – meaning further away from the LI ideal.
JimK says
Yep. That’s my guess at this point, but I’m not yet completely confident in my results.
Friedrich says
Hi Jim,
would you mind sharing the CC24 repro profile you created for the A7R4? Would be much appreciated.
Best regards
JimK says
I’m checking with Lumariver to see if that’s prohibited. It usually is with color profile makers, but I don’t see anything about it one way or the other on the Lumariver web site.
Adrien Le Falher says
Also interested by it if you figured it out 🙂
Andy Dodd says
Interesting, I’m assuming that it would be prohibited to redistribute a profile created by someone else, but in general, tool output is not considered subject to copyright by the tool author unless there’s something REALLY weird in the license.
RawTherapee has routinely included Lumariver-generated profiles and Andreas seems to have no problem with this. (I can’t find the link to Maciej’s datasets at the moment, but there is a location with the original shots for each dual-illuminant profile and the Lumariver project for each profile… Only the output DCPs are tracked in version control.)
belnea says
in i1profiler, caractérisation/light and you can selected “measure” and save le light
belnea says
or here 🙂 : http://www.northlight-images.co.uk/lighting-cri-with-i1profiler-and-the-i1pro/
Christopher says
Hi I found this article via google, and I’m a total rube when it comes to color science. My purpose is just selecting an accurate workflow for color reproduction.
My takeaway from this is that for Nikon z series cameras, Lumariver provides a more accurate result over creating profiles with xrite’s software. However I didn’t understand quantitatively how much more accurate it would be. So how large can a delta-E be in the formula…as in what is the min/max of the scale? L being 0-100 scale is easy to understand but when it is multiplied with A and B I hurt myself in confusion.
Ultimately when you get down to it, my question boils down to whether there is a visually detectable difference, not just a purely mathematically difference, between using Lumariver and Xrite for profile creation.
Thanks 🙂
JimK says
Neither CIEL*a*b or CIELu*v* are truly perceptually uniform, but the systems were designed so that 1 Delta-E is close to 1 Just Noticeable Difference (JND). There is no minimum Delta-E. There are several different formulae for calculating CIELab Delta-E, with the newest and most accurate one being Delta-E2000.
https://en.wikipedia.org/wiki/Color_difference
C V Horie says
I had no idea of the variability in software outputs.
The two top go-to profile creation softwares for heritage reproduction (my field) are BasicColor Input and Golden Thread. Have you thought of doing this all over again with these?
Thank you
JimK says
Interesting. I’ve not used either of those programs. I was not able to find out much about either from the web. Do you have a link to materials that discuss the procedures and algorithms?