This is a continuation of testing that I’ve been doing on the Epson P800 printer. I’ve created a category called “Printers”, and put this post in that category. I will go back and find all the previous posts in this series and put them in the same category. If you go to the Category List (on the right in the desktop formatting), find “Printers” and click on it, you’ll see all the posts in the series.
In the last post in this series, I reported on the spreading of single-pixel-wide rows and columns of black or gray against a white background in a 720 ppi image printed by the P800 on Epson Premium Glossy Photo Paper with all the quality settings maximized including checking the “Finest Detail” box which makes the Epson driver halftone from a 720 ppi contone image. It looked like what should have been 1/720 inch wide rows and columns were closer to 1/480 if you were being generous, and wider if your tolerance for spurious ink was low.
A reader suggested doing a slanted edge MTF test on the printer to quantify any blurriness that results from the spreading. That seemed like a good idea to me. I did the test, and am reporting on the results here.
I printed out a low-contrast slanted edge target with the edge in several orientations:
- Vertical and horizontal edges aligned with the printer’s rows and columns, which would have to be tilted before scanning to make tham slanted.
- Vertical and horizontal edges that are pre-slanted, and were scanned with the paper square.
Conventional wisdom is that the edges in the first case should be sharper than the edges in the second case. I’ve always believed this, but never tested it, and this seemed like a good opportunity to do so.
A set up the printer as before:
- Color mode
- Epson PGPP
- Max quality
- Finest Detail
I scanned the edges on an Epson V850 Pro at 4800 ppi with unsharp masking on, and everything else off. I figured that Epson would know the right amount of unsharp masking for the scanner, and checked that by a method that I’ll describe at the end of this post.
The edges that lines up with the printer’s rows and columns were indeed the sharpest, but not by much. I’ll show you the results for them.
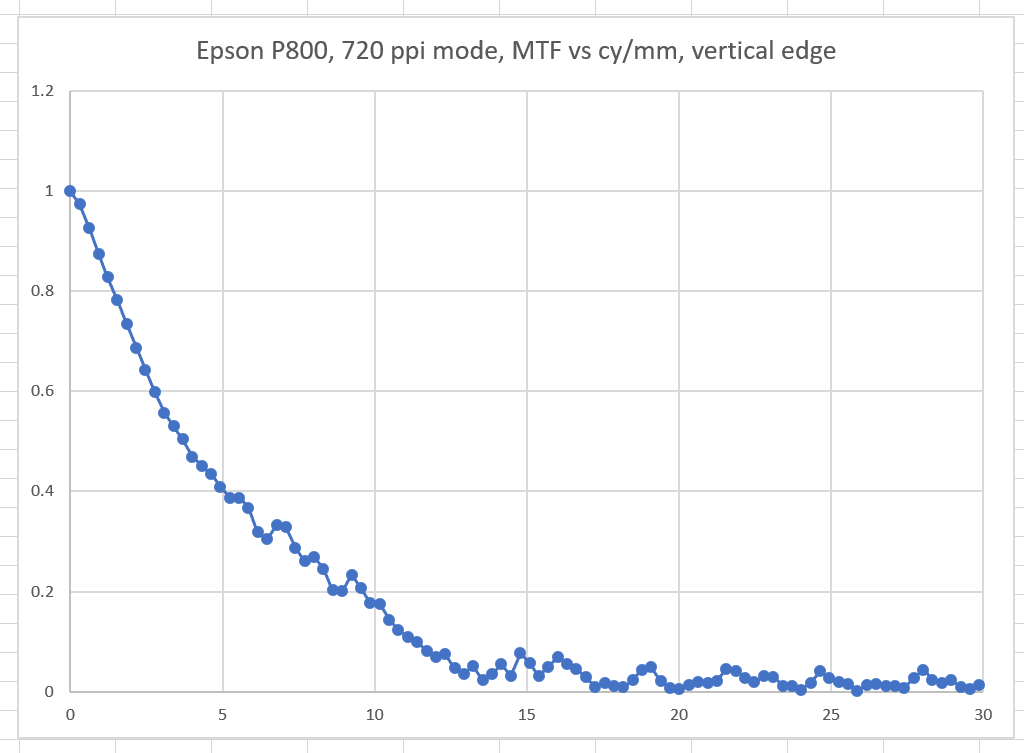
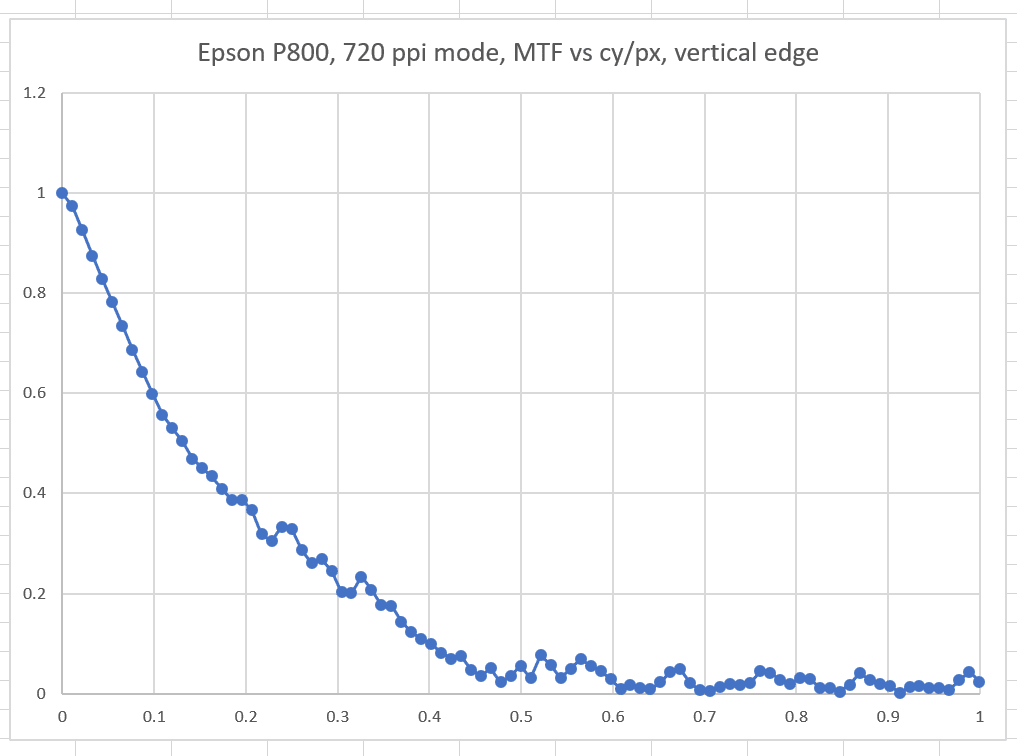
The vertical axis is the modulation transfer function, and the horizontal axis is the spatial frequency in cycles per millimeter. You can see that there’s not much contrast after about 12 or 13 cycles/mm. But you’re probably not used to thinking about print sharpness that way. In the following graph, I’ve converted the horizontal axis to cycles per the 720 ppi pixel of the printer:
If that’s not clear, maybe expressing the spatial frequency in terms of lines per inch (not line pairs per inch!) will help:
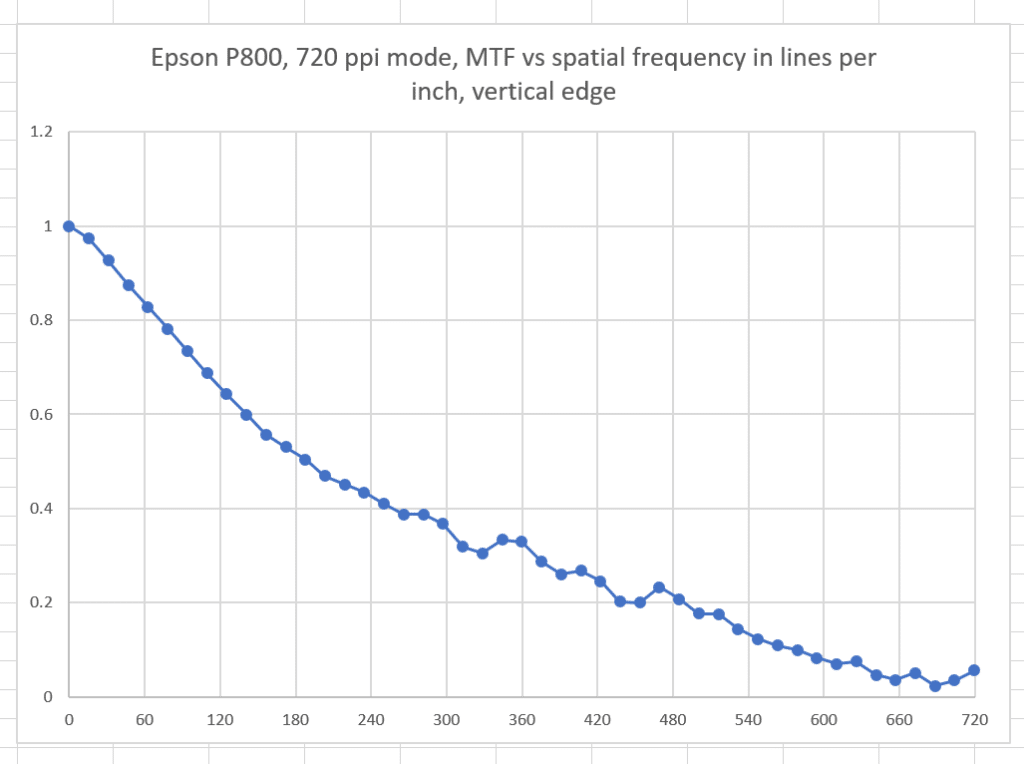
It’s pretty clear that there’s not a heck of a lot of contrast to be had above 360 lpi, which explains a lot about why I’ve not found that using 720 ppi mode for photographs provides much in the way of benefit over 360 ppi. But there is some, which explains why some people have decided that 720 ppi is better for their uses.
You’ve probably noticed that these MTF curves fall off much faster than the camera MTF’s you’re used to seeing. If we look at the edge profile, we can see why:
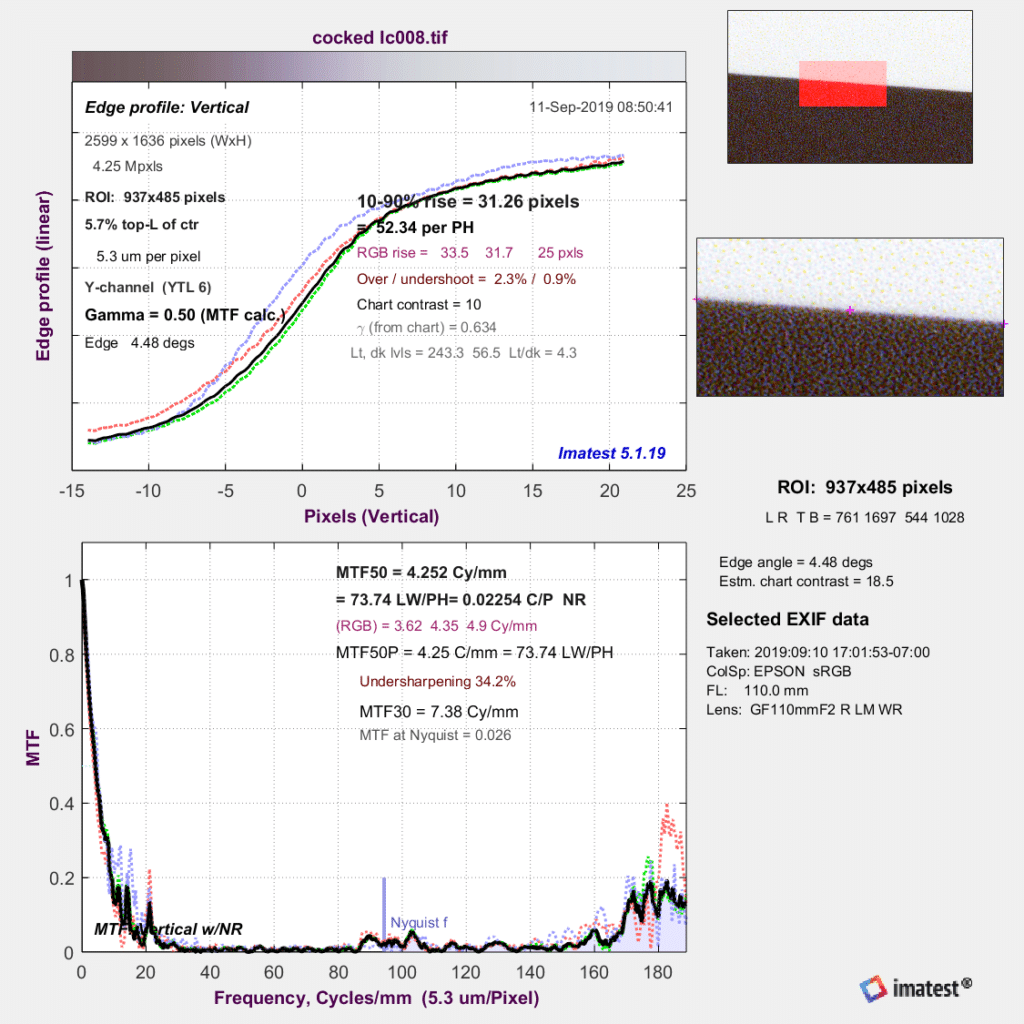
See those long tails on both sides of the steep part of the top curve above? That means that the printer is spraying black well away from the edge on the light side, and that it takes a while on the dark side for the density to build up to where it will eventually be.
About this time, you’re probably thinking, “Do those curves measure the performance of the P800 or of the V850?” That occured to me, too, so I scanned a sputtered Air Force target on a glass substrate:
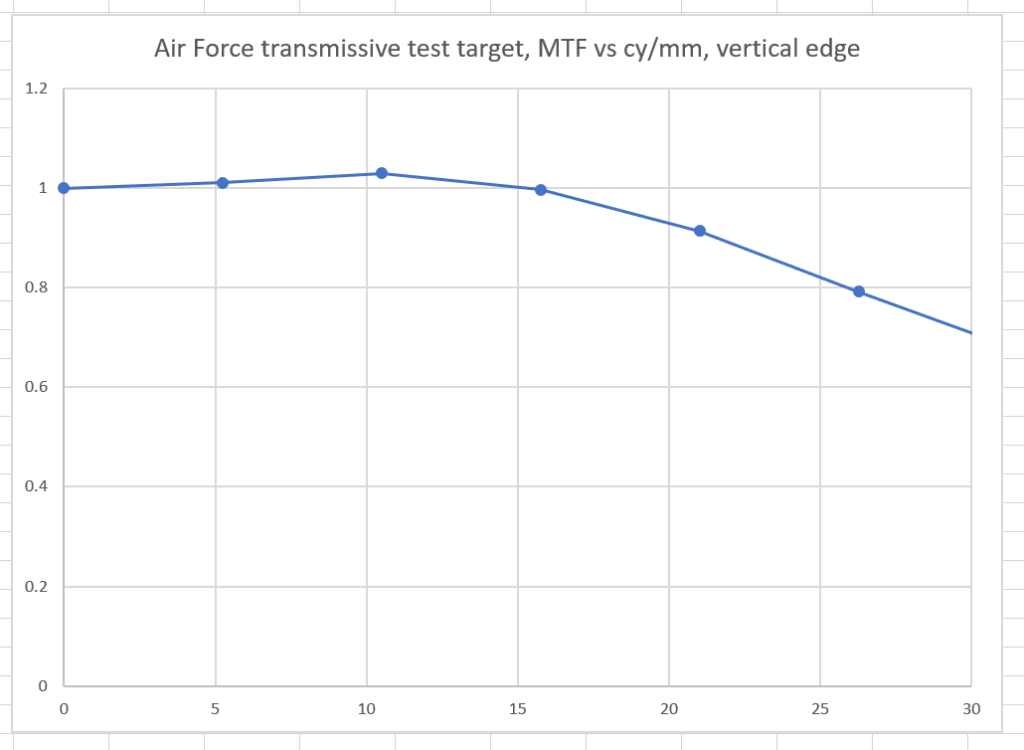
The first thing to note is that the amount of unsharp masking in the scanner driver appears to be approximately correct, if slightly overdone. The second is that there is virtually no loss at 15 cycles/mm which is about 360 ppi, so we’re measuring the printer’s MTF here, not the scanner’s.
Thanks for the test, the results are very clear.
It occured to me after I left the comment on the last post that what I suggested was actually two things. One was the slanted edge resolution test that you did. The other is a staircase pattern visual test. Is it possible to see 1/720 inch steps, when we print a staircase pattern where each step is 1/720 inches high and say 1/90 inches long?
Best regards,
Anders Lundeby
See this:
https://blog.kasson.com/printers/epson-p800-graphics-at-720-ppi/
First, thanks for all the wonderful research you are doing — and publishing here!
> which explains why some people have decided that 720 ppi is better for their uses
Well, honestly speaking, the graphs above ALONE cannot explain this. One also needs graphs for 360ppi printing!
For example — up to 180 lp/in, the shown MTF is above 33% — which is not a big deal to COMPLETELY compensate on a pre-printing stage (for photographic images, where one would not have too high contrast on so high spacial frequencies). I doubt anything like this is possible with 360ppi printing.
What worries me on the graphs above is the non-0 slope near 0. Mathematically, it would mean VERY slowly-delaying lobes of PSP. (This is what happens for lenses due to diffraction.)
It is not possible with a printer, right? (One does not expect SOME ink present ARΒITRARILY far from a printed region!) I would suspect the algorithms building these curves…
Slanted-edge is ill-posed to measure MTF at very low frequencies. The algorithm’s accuracy is worst at very low (RoI and filtering issues) and very high frequencies (noise).
Hi Jim,
Thanks – the results are quite informative. It appears that Epson has designed this printer very well in this regard. Its MTF drops to zero just about exactly at the spatial frequency that corresponds to the “sampling” (plotting) frequency and is almost linear inside the passband. It is in that sense, quite the same as if someone had a “Q=2” diffraction limited imaging system.
I do wonder – if they made a 1440ppi model or higher, at what point does the paper limit the result, and at what point is finer plotting invisible to the eye. I suppose we could break out SQF and all that to see how close to perfect this printer is under some viewing assumptions.