This is the eleventh in a series of posts on color reproduction. The series starts here.
Sorry about the terse title. There are going to be a bunch of similar posts, and I wanted to make this one easy to find later. ASP stands for Adobe Standard Profile. I think you can figure out the rest. For more information on where I got the numbers that we’ll be looking at in this post, see here.
Here are the results that I got from shooting the Macbeth color checker with a 6000K illuminant, white balancing to the third lightest gray square in Lr CC 2015 (current version), using the Adobe Standard Profile, and default settings otherwise.
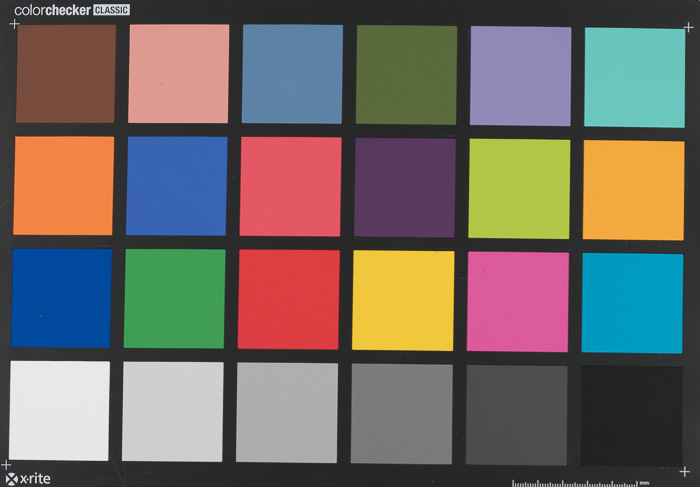
Note that this is an sRGB image, and some Macbeth colors are outside the sRGB gamut.
And here are the numbers I got from Bruce Lindbloom’s color checker image analyzer:

Both are the same images as in the previous post, and are included here for your convenience.
Before I start talking about what the numbers mean to me, let me comment on my methodology. I’m trying to keep this analysis at a level where almost all of my readers, should they be so inclined, can duplicate my results. That’s why I started with Bruce’s spreadsheet, which can be freely downloaded from his web site.
However, there are two issues.
The first is that Bruce locked his spreadsheet, and therefore it’s awkward to preprocess inputs or postprocess outputs. I could recreate his calculations in Excel, but that brings me to my second issue.
Excel is not the tool that I’d choose for these calculations. Matlab is. However, I know the minute I switch to Matlab I’m going to lose most of you. Therefore, let’s stumble along with Bruce’s sheet and see how far we can go.
The fifth and sixth column of numbers are the measured results for the two Lab chromaticity axes. Look at the last six rows of numbers; they are the ones for the gray patches. Note that there is one place where there is over one Delta E chromaticity error. Now look to the left at the Pro Photo RGB values measured in Photoshop (Ps) that produced the Lab errors. All are within one count of the same value for each patch. Ps is storing the test image in its 15+ bit format, and rounding the values to 8 bits. Thus, the least significant bit (LSB) accuracy is plus or minus one bit. So those departures from grayness can’t be trusted.
What to do? Bruce’s spreadsheet doesn’t accept higher precision values. It’s also set up so you can’t do precalculations and enter them programmatically. So, the obvious way to fix this problem, converting from 15+ bit unsigned integer to floating point values in the range [0,256] will involve double data entry. Ugh.
There’s a half measure, though. By using a smaller color space that still can accommodate all the Macbeth chart colors, say Adobe RGB, we can minimize the effect on the CIELab values of the one-LSB uncertainty. I’ll do that next time.
As it is, the measured gray axis chromaticity values are remarkably close to perfect, It looks like there is little, if any, “twist” in this profile, at least above L* values of 20 or so.
The next thing that jumped out at me is that the Lr processing has introduced a film-like nonlinearity in the luminance axis. Shadow values are slightly depressed. My guess is, if the Macbeth chart’s black were blacker, we’d see significantly more depression. Midtones are boosted, and highlights are compressed. Here’s what that looks like graphically:
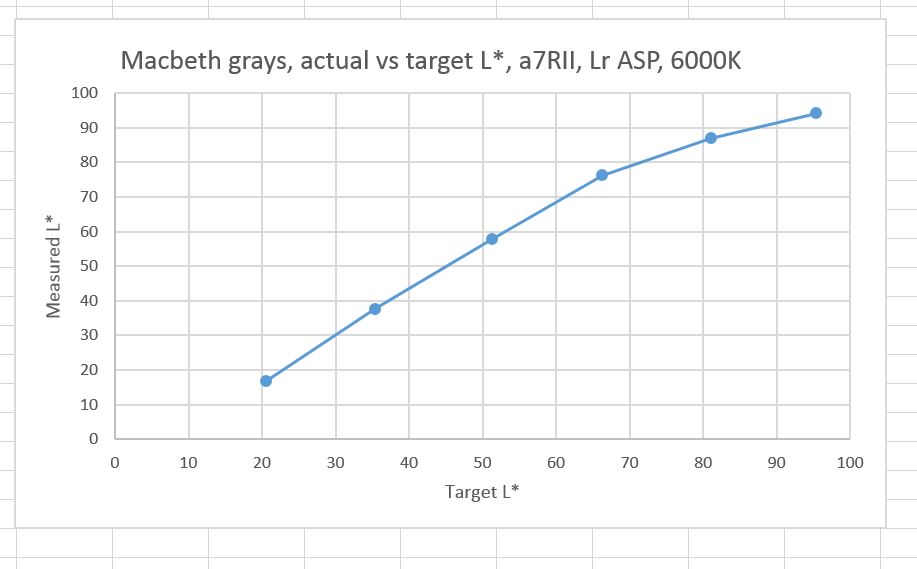
This cannot be an accident. It has to be a deliberate decision on the folks at Adobe to increase the midtone contrast at the expense of the highlights and the shadows to make the images “pop”. And some people complain that the Lr default processing is flat — go figure.
Such a deliberate nonlinearity is bound to give us big Delta E’s, and you could argue that Lr shouldn’t be penalized for that. What if we look at the chromaticity error, Delta ab?
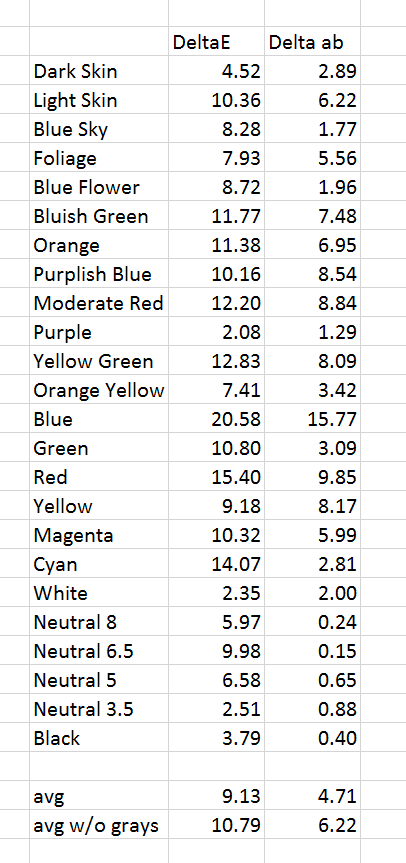
You can see that, if we leave the gray patches out, the average chromaticity error is a quite-respectable six Delta ab.
Does Lr try to make the colors pop by increasing chroma? On average, it does not:
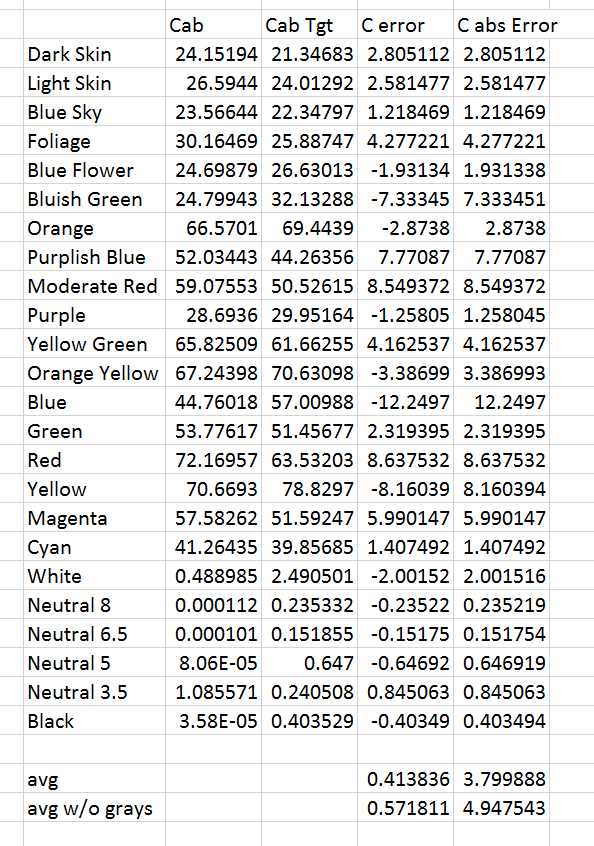
You can see that the average chroma error is low, although the average of the absolute value of the chroma errors is not.
If we look at the actual vs the target chromaticities:
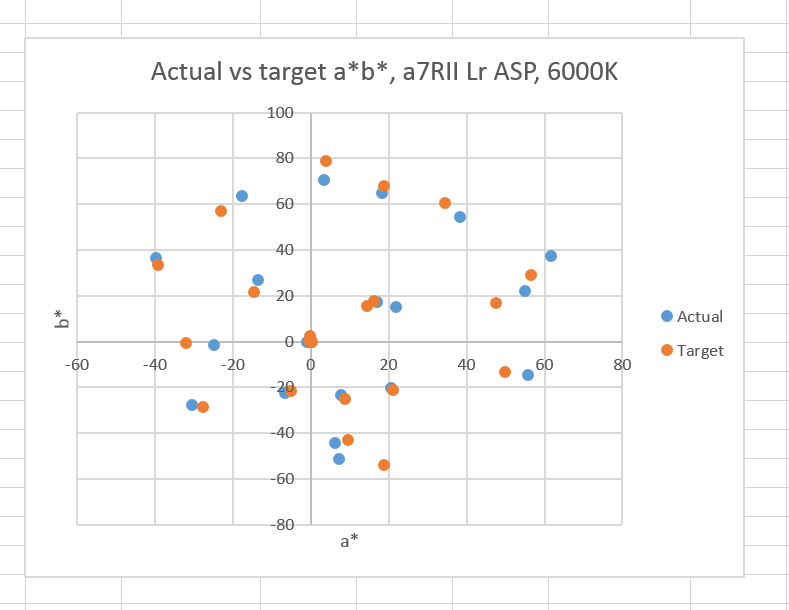
We can see that light skin has a reddish bias. I believe this is intentional. The highly chromatic reds are rendered even redder; I’m not sure what that’s about. The magentas are pulled towards blue; I think that’s to avoid the “purple sky” problem. I don’t detect any other patterns.
All in all, it looks like what Adobe has done with this profile is quite sensible, and it should serve the needs of many photographers well. Of course, the default settings are just a starting place, but this one is not a bad one.
[The following was added on July 11, 2016]
I’ve come across a comment by Eric Chan that bears on this post:
in general the idea is to optimize over a set of training data, as you say. Using a ColorChecker or variant is a popular approach, and doing so will give you the ability to get very consistent renderings of those targets from camera to camera. However, that does not guarantee consistency across other materials not in the training set, nor does it even guarantee good performance on those other materials. The inverse is also true: profiles that have been designed to work well on real-world data may not work well (or consistently) for test targets. (This is one reason why the Adobe Standard profile doesn’t measure up very well on a ColorChecker, e.g., if you use Imatest or a similar tool to check colorimetric accuracy. That is by design.)
A 3×3 or 3×4 matrix (i.e., linear transform) is usually enough to get you good scene colorimetry estimates, provided that your training data generalizes well to the types of scenes you photograph. Non-linear transforms such as chroma-dependent or lightness-dependent hue twists (usually implemented via lookup tables for convenience) are useful for correcting residual errors or trying to nail specific colors. They are also useful for implementing more complex color appearance models such as CIECAM97 or CIECAM02.
You can see the whole conversation here.
> All in all, it looks like what Adobe has done with this profile is quite sensible, and it should serve the needs of many photographers well. Of course, the default settings are just a starting place, but this one is not a bad one.
if you will use tools like dcptool from SandyMc then you can quickly make things better – make Adode Standard profile untwisted/invariant, put truly linear curve inside, compensate hidden exposure correction… then using BabelColor Patchtool and comparing ACR (use process 2010, not 2012 for comparisons) conversion of the target shot from Imaging Resource raw (for example A7R2hVFAI000100.ARW) vs CC24 Classic (pre Nov 2014 pigments) measurements from BabelColor (average of 30 different samples = http://www.babelcolor.com/download/CC_Avg30_spectrum_CGATS.txt ) you can do average dE2K = ~2.1x, median dE2K = ~1.8x and max dE2K = ~4.7x…. much better than with the non gutted Adobe Standard… and 1 minute work…
modded ASP for A7R2 = https://app.box.com/s/5lk8ww7gowhn7v5cxzi03ukwuzn8zdka
and speaking about C1 -> this simple, originally matrix + trc, profile = https://app.box.com/s/bl9fmry35dn7fh6vda9mmxyjy6kdp068 (with “linear scientific” curve in C1… never “linear” !) does pretty much the same (a little better actually) dE errors with A7R2hVFAI000100.ARW from I-R : average dE2K = 1.6x, median dE2K = 1.6x, max dE2K = 4.0x for CC24 Classic vs http://www.babelcolor.com/download/CC_Avg30_spectrum_CGATS.txt