• site home
  • blog home
  • galleries
  • contact
  • underwater
  • the bleeding edge

the last word

Photography meets digital computer technology. Photography wins -- most of the time.

You are here: Home / The Last Word / Another medium tele test — Summicron LoCA

Another medium tele test — Summicron LoCA

February 24, 2016 JimK 3 Comments

This is a continuation of a test of the following lenses on the Sony a7RII:

  • Zeiss 85mm f/1.8 Batis.
  • Zeiss 85mm f/1.4 Otus.
  • Leica 90mm f/2 Apo Summicron-M ASPH.
  • AF-S Nikkor 85mm f/1.4 G.
  • Sony 90mm f/2.8 FE Macro.

The test starts here.

This posts repeats the testing regime of the previous one with a different lens, the Leica Apo-Summicron. The term Apo as applied to a lens does not, unfortunately, have a precise meaning. In general, it means that the lens is corrected for three wavelengths of light, but there is no universal specification of what those wave lengths should be (550, 551, and 552 nm, anybody?) and how good the correction has to be. This test doesn’t use single wavelengths anyway, but rather groups of them that are determined by the camera’s spectral response, the lens itself, the target reflectivity, and the lighting. In general, the designation Apo on a lens means that the folks in marketing think that the lens is well corrected by their company’s standards, and that they would like you to think that, too.

How well-corrected is the ‘cron for LoCA? We shall see.

I lit the target with two Westcott LED panels, and set the color temperature to 5000K. I mounted a Sony a7RII with an Apo- Summicron on it to the Cognisys computer-driven focusing rail. I set the controller up to use 192mm of travel and make 49 exposures 4mm apart. I set the assembly 3.3 meters from the on-axis target, mounted the lens, focused a little towards the front from mid-rail using manual focusing, and exposed at 49-shot series from f/2 through f/8.  I used Jack Hogan’s Matlab program, MTF Mapper, and DCRAW to calculate the MTF50s for the raw color planes, imported the data into Excel, and plotted the results  in cycles per picture height vs image distance change. Earlier I showed curves that were referenced to subject distance, but I’m changing over to measuring focus shift at the sensor so as to be able to more fairly compare LoCA performance of lenses of different focal length.

At f/2:

cron 2h loca

cron 2v loca

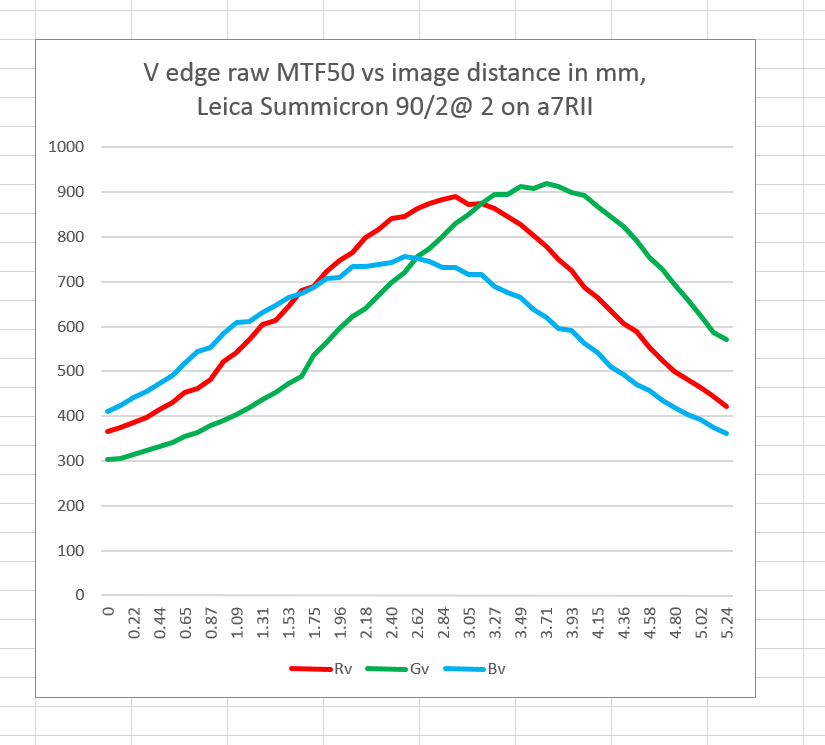
The top set of curves is for the horizontal edge. The bottom is for the vertical edge. There is a slight bit of astigmatism as shown by the difference in the position of the peaks of the two curves, but nothing that would concern anyone in actual use of the lens. In the Batis, we saw the green and the blue planes being focused in the same location. Not so here; the green and blue are the furthest apart. The spread between the three planes is a bit over 3 mm, somewhat less that for the Batis at a the same f-stop.

At f/2.8:

cron 28 h loca

cron 28 v loca

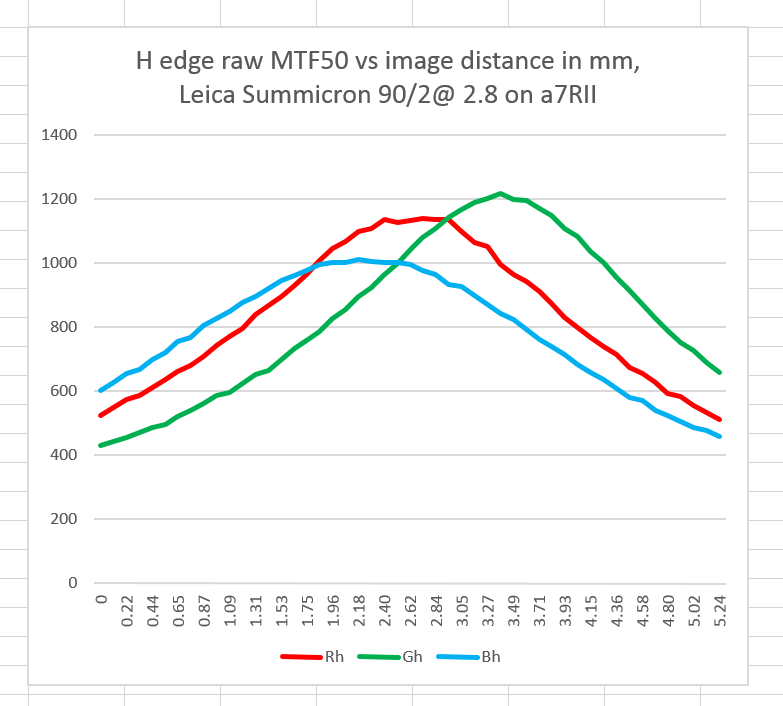
Not much has changed, except for focus shift.

At f/4:

cron 4h loca

cron 4v loca

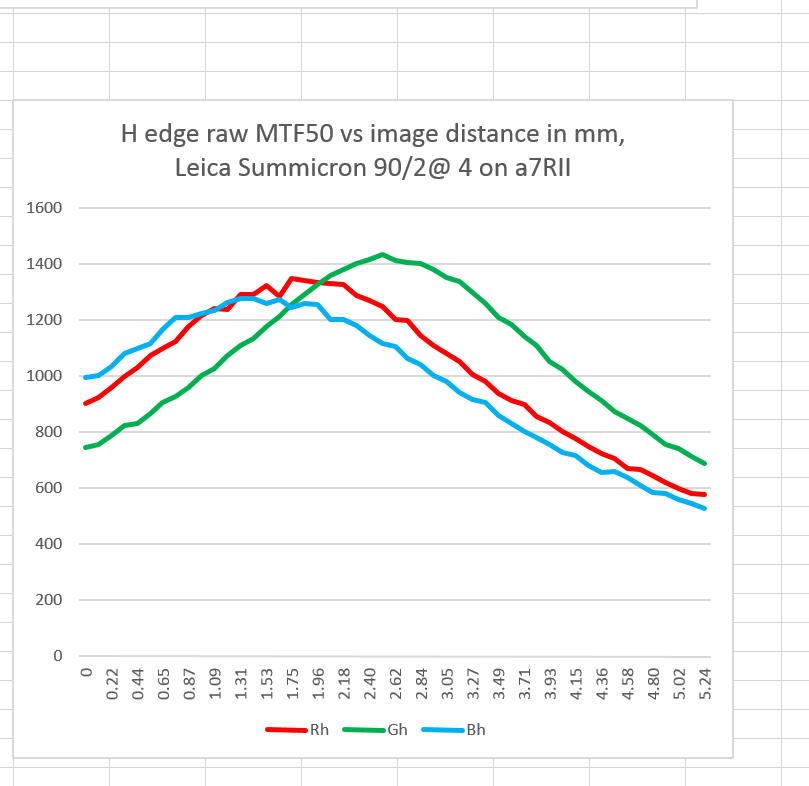
Now the peaks are coming closer together.

At f/5.6:

cron 56h loca

cron 56v loca

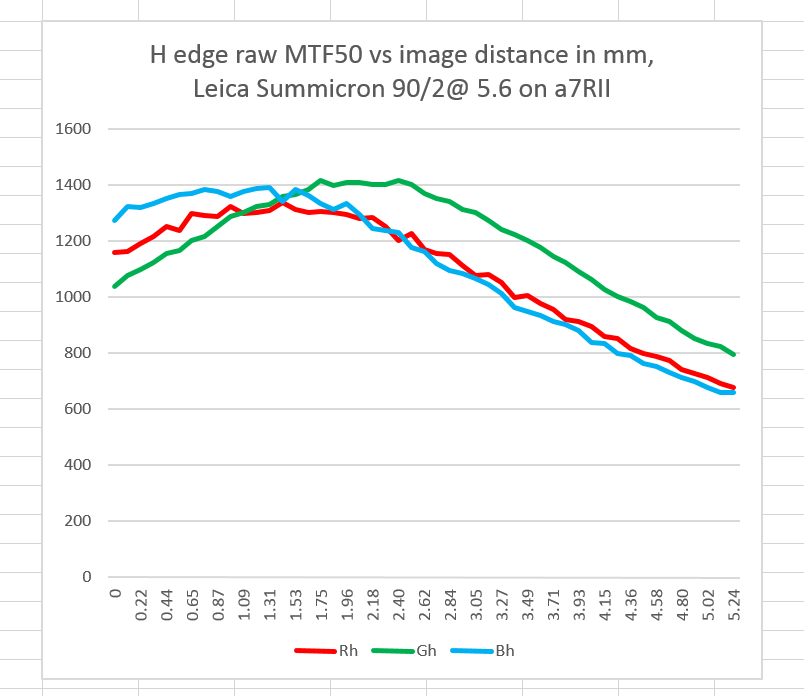
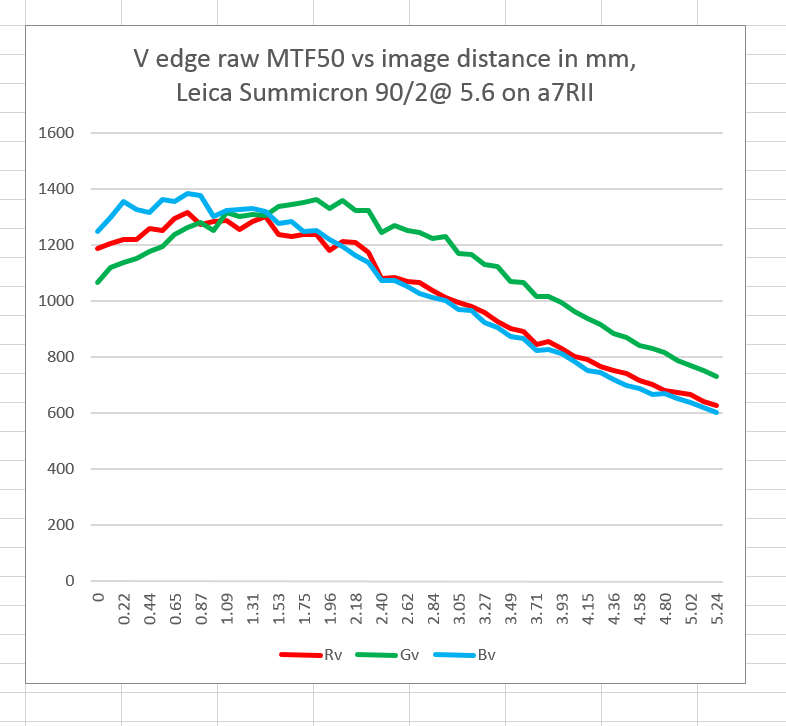
The red and blue planes are almost identical, and the green is slightly shifted.

And finally, at f/8:

cron 8h loca


cron 8v loca

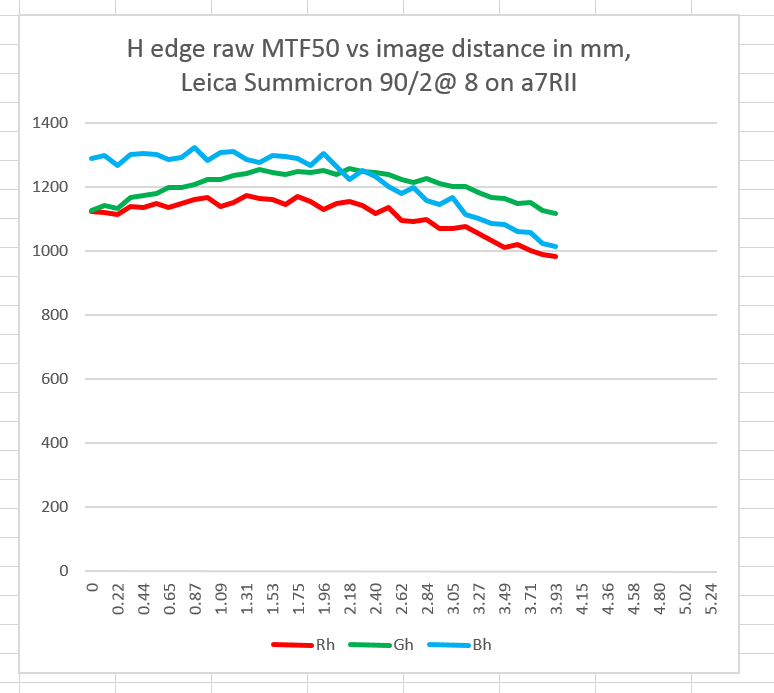
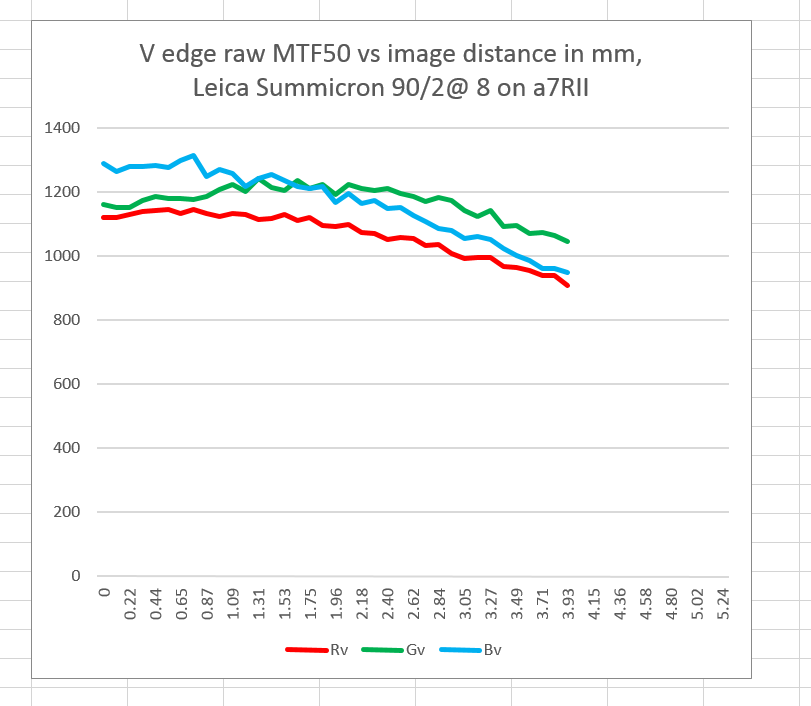
The increase depth of field has swamped out the LoCA. The reason why the curves don’t do all the way across the graph is that the Cognisys rail had a hiccup and aborted the operation. It seems to do that about one exposure in 1000, which is too infrequent to troubleshoot, but not too infrequent to be a PITA. Fortunately this time it happened on the last run of the series.

The Last Word

← Another medium tele test — Batis LoCA Another medium tele test — Otus & Nikon LoCA →

Comments

  1. CarVac says

    February 24, 2016 at 11:33 am

    Looks better corrected than the Batis.

    I’ve noticed that different lenses have different LoCA color fringes: most standard lenses are magenta/green, where red and blue hang together more, and others (apparently including the Batis) are red/cyan where blue and green match more closely. A notable example of the latter is the Samyang 35/1.4.

    Personally I prefer the look of lenses with more green/magenta if there is to be any fringing at all, but that may be just what I’m used to.

    Reply
  2. Jack Hogan says

    February 25, 2016 at 3:32 am

    So where exactly in these charts is a lens ‘best focus’? Considering the photopic curve and relative number of cones I would guess when the green channel hits a peak.

    Jack

    Reply
    • Jim says

      February 25, 2016 at 8:50 am

      If best focus is the peak of the luminance curve, then best focus would be a little bit away from the peak of the green curve in the red direction. It’s hard to say, since we’re not looking at planes that have any colorimetric meaning, although we call then red. blue, and green. They’re just raw planes.

      Reply

Leave a Reply Cancel reply

Your email address will not be published. Required fields are marked *

May 2025
S M T W T F S
 123
45678910
11121314151617
18192021222324
25262728293031
« Apr    

Articles

  • About
    • Patents and papers about color
    • Who am I?
  • How to…
    • Backing up photographic images
    • How to change email providers
    • How to shoot slanted edge images for me
  • Lens screening testing
    • Equipment and Software
    • Examples
      • Bad and OK 200-600 at 600
      • Excellent 180-400 zoom
      • Fair 14-30mm zoom
      • Good 100-200 mm MF zoom
      • Good 100-400 zoom
      • Good 100mm lens on P1 P45+
      • Good 120mm MF lens
      • Good 18mm FF lens
      • Good 24-105 mm FF lens
      • Good 24-70 FF zoom
      • Good 35 mm FF lens
      • Good 35-70 MF lens
      • Good 60 mm lens on IQ3-100
      • Good 63 mm MF lens
      • Good 65 mm FF lens
      • Good 85 mm FF lens
      • Good and bad 25mm FF lenses
      • Good zoom at 24 mm
      • Marginal 18mm lens
      • Marginal 35mm FF lens
      • Mildly problematic 55 mm FF lens
      • OK 16-35mm zoom
      • OK 60mm lens on P1 P45+
      • OK Sony 600mm f/4
      • Pretty good 16-35 FF zoom
      • Pretty good 90mm FF lens
      • Problematic 400 mm FF lens
      • Tilted 20 mm f/1.8 FF lens
      • Tilted 30 mm MF lens
      • Tilted 50 mm FF lens
      • Two 15mm FF lenses
    • Found a problem – now what?
    • Goals for this test
    • Minimum target distances
      • MFT
      • APS-C
      • Full frame
      • Small medium format
    • Printable Siemens Star targets
    • Target size on sensor
      • MFT
      • APS-C
      • Full frame
      • Small medium format
    • Test instructions — postproduction
    • Test instructions — reading the images
    • Test instructions – capture
    • Theory of the test
    • What’s wrong with conventional lens screening?
  • Previsualization heresy
  • Privacy Policy
  • Recommended photographic web sites
  • Using in-camera histograms for ETTR
    • Acknowledgments
    • Why ETTR?
    • Normal in-camera histograms
    • Image processing for in-camera histograms
    • Making the in-camera histogram closely represent the raw histogram
    • Shortcuts to UniWB
    • Preparing for monitor-based UniWB
    • A one-step UniWB procedure
    • The math behind the one-step method
    • Iteration using Newton’s Method

Category List

Recent Comments

  • JimK on Goldilocks and the three flashes
  • DC Wedding Photographer on Goldilocks and the three flashes
  • Wedding Photographer in DC on The 16-Bit Fallacy: Why More Isn’t Always Better in Medium Format Cameras
  • JimK on Fujifilm GFX 100S II precision
  • Renjie Zhu on Fujifilm GFX 100S II precision
  • JimK on Fuji 20-35/4 landscape field curvature at 23mm vs 23/4 GF
  • Ivo de Man on Fuji 20-35/4 landscape field curvature at 23mm vs 23/4 GF
  • JimK on Fuji 20-35/4 landscape field curvature at 23mm vs 23/4 GF
  • JimK on Fuji 20-35/4 landscape field curvature at 23mm vs 23/4 GF
  • Ivo de Man on Fuji 20-35/4 landscape field curvature at 23mm vs 23/4 GF

Archives

Copyright © 2025 · Daily Dish Pro On Genesis Framework · WordPress · Log in

Unless otherwise noted, all images copyright Jim Kasson.