The last two posts have been about my experiences using the X-Rite CC24 and CCSG targets and X-Rite’s Color Checker Camera Calibration program with both diffuse and direct solar illumination. I found anomalies between the two targets, which I thought might be related to lighting and glare. But today I discovered that, even with the same 45/0 lighting and a spectrophotometer, the CC24 patches on the CCSG target don’t match the CC24 patches on the actual CC24 target.
I used an ancient X-Rite i1 Pro (model 1, version D) spectrophotometer, and BabelColor PatchTool. Here’s a visual indication, with the CC24 patches in the upper left, and the CCSG patches in the lower right.
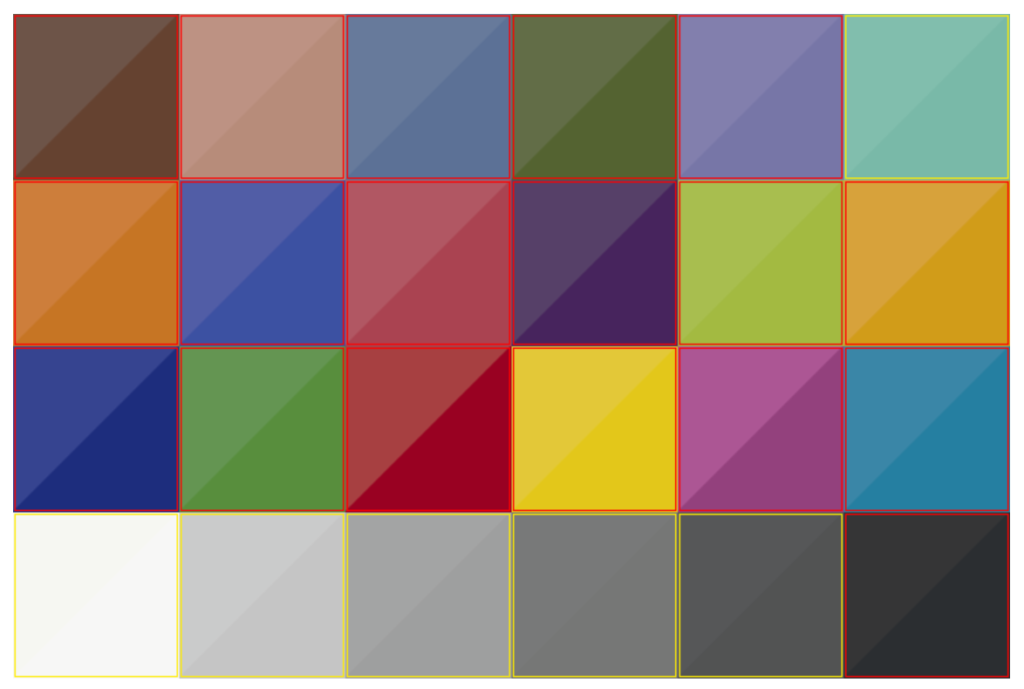
I couldn’t figure out how to export the above image from PatchTool — I’m new to it — so it’s a screen capture in my Eizo workstation monitor’s space, which is roughly Adobe RGB. Here’s a histogram of the CIELab Delta E differences between the two patch sets.
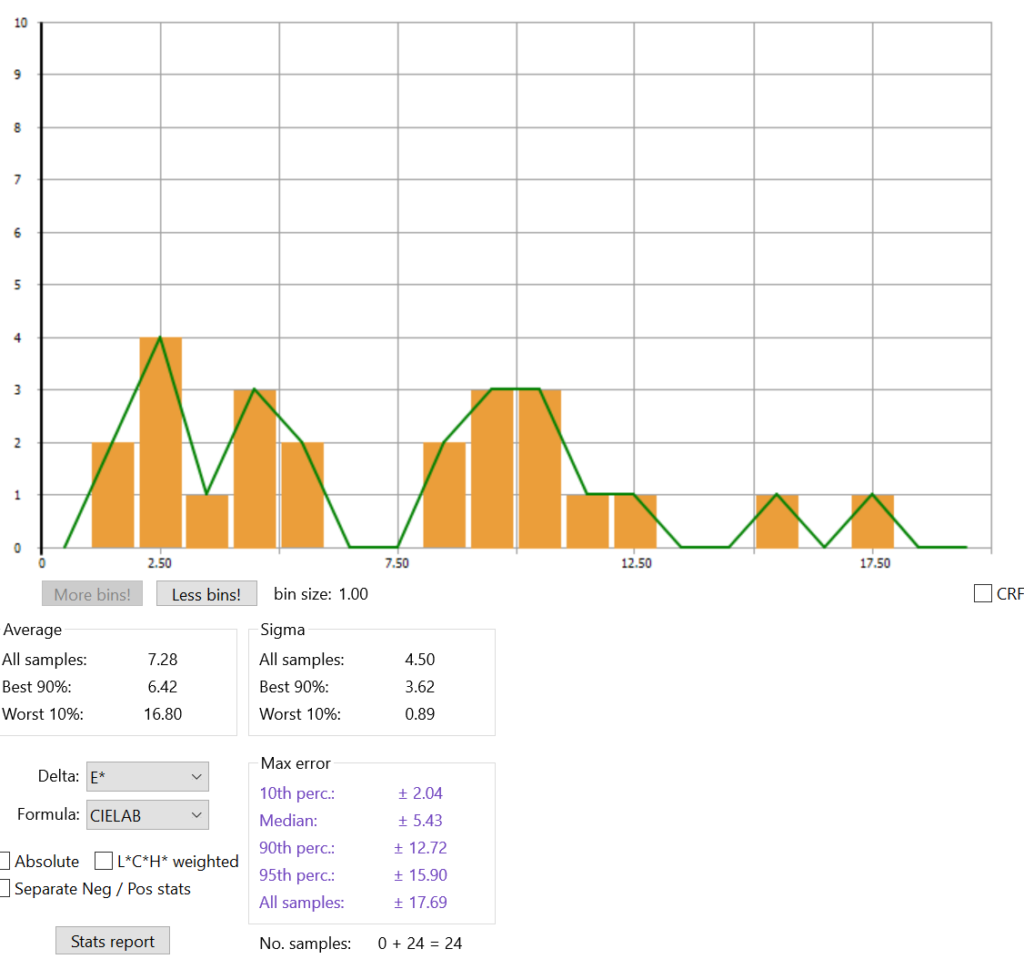
And here are the details. The green values are from the CC24, and the pick ones came from the CCSG:
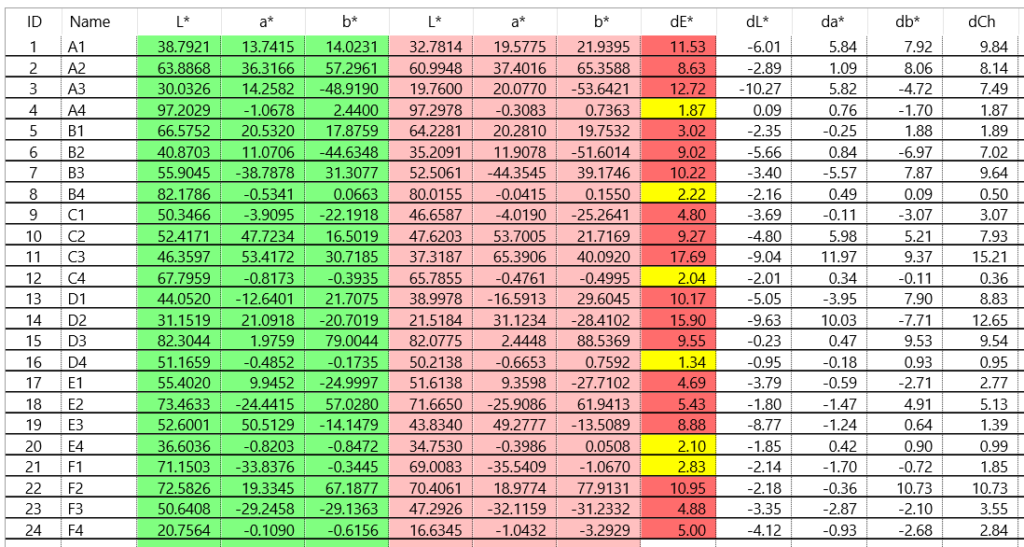
Well! That explains a lot. I’ll be doing more testing and will circle back around to the accuracy tests I tried to do in the first two posts.
“Using reference data from X-Rite, there is an average DeltaE*ab difference of about 7 (3.7 in CIEDE2000) between the standard ColorChecker and the corresponding patches of the ColorChecker SG. This has been confirmed with measurements on two charts (the measured values of these two charts are very close to one another however, which is good since it shows manufacturing consistency). We see the same statistics when comparing the two charts BEFORE or AFTER the November 2014 formulations changes. Because of this, it is not recommended to use the average spectral data, the RGB and L*a*b* values, and the images of the standard ColorChecker for comparison with the “equivalent” patches of the ColorChecker Digital SG chart.”
from http://www.babelcolor.com/colorchecker-3.htm#CCP3_SGproblem
On the matter why I think that SG charts should be custom-measured: using the same spectrometer, I measured differences between 2 SG charts. Ignoring all border parches, I got
11 patches with dE00 > 2,
8 pathes have da > 2
11 patches have db >2
Thanks for all your help on this, Iliah. Here’s what I’ve done today:
I’ve updated optprop with my measured values of one of my CC24’s and my CCSG in addition to the supplied pre-2014 values that came with the package.
I’ve ordered an i1 Pro 3 (I hope that PatchTool recognizes it).
I plan to scan my three CC24’s (including the one that arrived today) when the new i1 comes. I’ll rescan my CCSG. I’ll compare my CCSG results with the ones I got from you. Only after that will I go back to the profiler testing.
Sorry to bring unwelcome news, but i1 Pro 3 may be not supported directly.
The X-rite firmware can probably export data in some format readable by Patchtool.
Sorry to hear you need to test reference cards…
With the Classic and SG cards side by side in the same image the differences of the two sets of 24 are indeed quite readily visible.
However profiles that I made from each card in Lumariver, and then examined for differences in the resulting colors of the Classic’s of patches as presented in Lightroom, were able to contain the colors a little better than what one might fear from Iliah’s reported average delta E of 7. Minimum/Median/Maximum differences I obtained were L: -0.90/0.00/0.30, a: -3.80/0.00/2.90, and b: -4.70/-0.25/3.20. The Pythagorean distances (i.e., not the current delta-E calculations) were 1.55 median and 4.75 maximum.
Maybe it doesn’t necessarily matter that the 24-patch subset of the SG isn’t a clone of the Classic (as long as one has access to accurate reference values of course).
I’ve noticed that, but I didn’t know whether to blame inadequacies in the lighting or not. When you can see it with a spectrophotometer with 45/0 geometry, as Iliah and I both have, that’s a smoking gun.
I think that’s true, but if the target lighting is other than D50, to measure conformance, we need the CCSG reflectance spectra, which are not published by X-Rite. Not everyone is willing and able to do their own spectral measurements.
Dear Tony:
> Iliah’s reported average delta E of 7
I was quoting folks from BabelColor. And, by the way, they literally made it their business to deal with profiling targets and measurements.
> However profiles that I made from each card in Lumariver
Using respective standard references, right?
> Minimum/Median/Maximum differences I obtained were L: -0.90/0.00/0.30, a: -3.80/0.00/2.90, and b: -4.70/-0.25/3.20.
Having 6.7 da and 7.9 db absolute values IMHO that doesn’t look very good, pardon the pun 😉
>Dear Tony:
>> Iliah’s reported average delta E of 7
>I was quoting folks from BabelColor. And, by the way, they literally made it their business to deal with profiling targets and measurements.
They’re the best reference that I am aware of, and I’ve been using their “average of 30 cards” values as my gold standards.
>> However profiles that I made from each card in Lumariver
>Using respective standard references, right?
Yes, I simply accepted their stored values.
>> Minimum/Median/Maximum differences I obtained were L: -0.90/0.00/0.30, a: -3.80/0.00/2.90, and b: -4.70/-0.25/3.20.
>Having 6.7 da and 7.9 db absolute values IMHO that doesn’t look very good, pardon the pun
As it happens Lightroom’s Adobe Color profile didn’t do much better if at all.
Here are my delta-E2000 figures, min / median / max:
AdobeColor vs Babel30: 0.79 / 2.71 / 6.98
Luma24 45° vs Babel30: 0.73 / 3.33 / 6.50
LumaSG 45° vs Babel30: 0.97 / 3.55 / 6.55
LumaSG 45° vs Luma24 45°: 0.46 / 1.10 / 2.30
AdobeColor vs Luma24 45°: 0.80 / 2.79 / 5.25
Luma24 45° vs Luma24 20°: 0.37 / 0.69 / 1.83
LumaSG 45° vs LumaSG 20°: 0.42 / 4.32 / 11.85
SG 20° vs Babel30 has da = 38 and db = 57.
All measurements were made on the Classic card’s 24 patches within a shot made with the recommended 45° sun angle setup.
“LumaXX 45°” used profiles I made from a shot taken in the recommended technique. “LumaXX 20°” used profiles made from a shot taken with the purposely bad technique of too small a sun angle. The surface glare was readily apparent on the SG card.
It looks like my Classic card disagrees too much with BabelColor’s average.
That was for pre-November-2014 CC24s.
I would think that the reference data files in LumaRiver Profile Designer are pretty good.
C:\Program Files\Lumariver Profile Designer\data
I would recall that I have used those as reference data in my comparisons.
I had a big fight with Argyll CMS and also i1Studio, the first one doesn’t find my ColorMunki Photo the other one severely miscalibrates my monitor, like Delta E 200 (I am just guessing).
I may mention that I had a sobering experience, once upon the time. It was just a macro shot of a flower, but I had severe posterisation on some yellow colors. It was like this:
Adobe Standard – OK
Adobe DNG Profile Editor, with tweaks – posterisation
Capture One – posterisation
CPP – posterisation
DCamProf – OK
https://www.getdpi.com/forum/sony/55875-case-bad-posterisation.html?highlight=
This thread may have some interesting content, as many knowledgeable folks has chimed in:
https://www.getdpi.com/forum/medium-format-systems-and-digital-backs/59120-capture-one-lr6.html?highlight=
Best regards
Erik
“That was for pre-November-2014 CC24s.”
Fair point, but the wrinkles I’m hoping to address are 4X the differences between 2014 (0.15/0.81/1.50, min/med/max).
I hypothesized: “It looks like my Classic card disagrees too much with BabelColor’s average.”
That’s not going to resolve things. The ColorMunki Photo says that my CC24 is off from Babel30 by only 0.19/0.65/1.44 and away from the >2014 version by 0.17/0.94/1.90.
I was talking about the gold standard part.