A reader has asked if I could take the methods that I developed for the handheld testing and apply them to tripod-mounted testing. The MTF-based technique offers the ability to test more conditions because of its automation, and provides objective, machine-generated results. However, the old procedure, with its visual analysis of ISO 12233 images, is more accessible to those with little interest in, or aptitude for, mathematics, and can be performed by anyone without having to purchase and learn how to use an image analysis program. You can also do the MTF testing with free Matlab code, but then you need to purchase and learn Matlab, a financially and intellectually more challenging undertaking than buying and learning Imatest.
I set up a D800E with a Zeiss 55mm f/1.4 Apo Distagon ZF.2 in landscape orientation on an Arca Swiss C1 cube and the heavy-duty RRS TVC-44 legs. I used the Fotodiox LED-200WA-56 for a light source. I set the camera to self-timer mode with a two-second delay. I also the the shutter to a three second delay. That meant that the camera would wait two seconds after I pressed the shutter release, and then raise the mirror. It would then wait three more seconds, and trip the shutter. I put a Heliopan ND filter on the lens, and set it to about three stops attenuation. I focused wide-open, and stopped the lens down to f/5.6. I set the ISO to 200, the exposure mode to A, and the light to 40. I adjusted the exposure compensation to get a shutter speed of 1/40 second. I made a series of exposures of this SFRPlus chart:
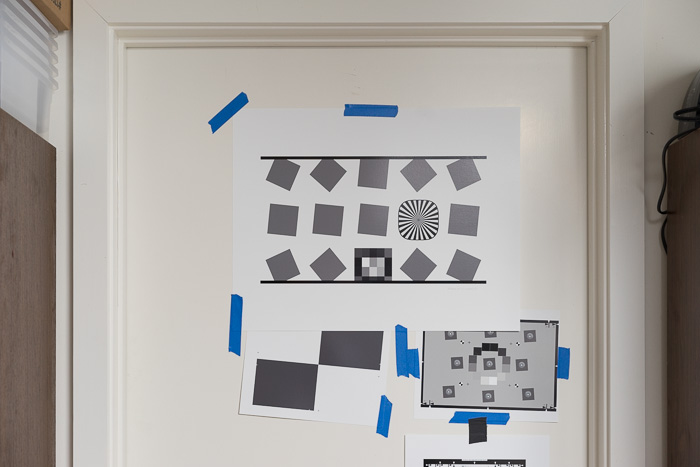
at 1/3 stop shutter speed intervals, achieving the shutter speeds I wanted my adjusting the ND filter and the light level. Then I did the whole series over with the shutter delay set to zero, so that the camera would wait two seconds after I pressed the shutter release, then raise the mirror and immediately trip the shutter.
I brought the raw files into Lightroom 5.3, adjusted white balance and exposure, with all other controls at default. I cropped to the target, exported s 16-bit TIFFs, and analyzed both vertical and horizontal edges in Imatest.
Here are the MTF50 results:
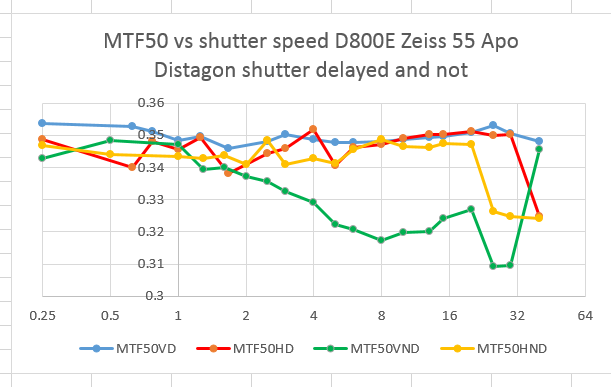
Shutter speeds are show inverted. Hence, 8 on the horizontal axis means 1/8 second, and 0.25 means 4 seconds.
Here’s what the legends mean:
- MTF50VND – MTF50, vertical edges, no shutter delay
- MTF50HND – MTF50, horizontal edges, no shutter delay
- MTF50VD – MTF50, vertical edges, three-second shutter delay
- MTF50HD – MTF50, horizontal edges, three-second shutter delay
There are some who say that looking for the point on the MTF curve where the contrast has dropped to 30 is a more useful measure. If you’re one of them, this set of curves is for you:
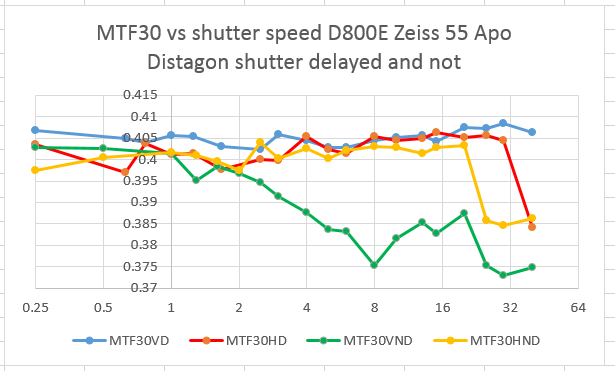
What do the curves tell us? First, they say that any observed changes are quite small, so that noise is a significant component of what we’re looking at. Second, they say that shutter delay mode helps a little bit at the longer shutter speeds, but that its advantage diminishes as the shutter speeds increase. Third, we can see that horizontal vibration, which affects vertical edges, is a larger source of blur for the undelayed shutter images at faster shutter speeds than vertical vibration, even though the shutter in the D800E moves up and down. That’s because the tripod is less stable side to side than up and down.
I ran a series of tests at higher shutter speeds without the ND filter, and the results were essentially uncorrelated with shutter speed:

The dotted lines on the above chart are straight lines fit to the similarly-colored data with an algorithm that minimizes the sum of the squared errors between the actual and fitted points. Some people are more used to such lines being called linear regressions. The fact that they are nearly flat indicates little systemic difference that spans the compass of the graph.
Don’t compare the numbers in the above graphs with those of the first charts. I refocused in between and, given the D800E’s subsampled live view, probably didn’t hit the same focus point. Thus, focus errors are different, and focus errors affect MTF measurements.
This is a surprise to me, and a welcome one. I thought shutter delay would make more difference.
Leave a Reply