• site home
  • blog home
  • galleries
  • contact
  • underwater
  • the bleeding edge

the last word

Photography meets digital computer technology. Photography wins -- most of the time.

You are here: Home / The Last Word / D810 ISO I00 filtered dark-field images

D810 ISO I00 filtered dark-field images

October 28, 2014 JimK Leave a Comment

I published some statistics yesterday on D810 dark-field images of various ISOs that had been filtered with low-pass filters of various sizes. I used 1xn kernels to filter out horizontal variations and leave the vertical ones, and nx1 kernels to to filter out vertical variations and leave the horizontal ones.

As an adjunct to the curves, I’m posting some of the images themselves. I used  symmetric reflection to get pixels for the kernel to process when it was near the edges of the image, and cropped the resulting image to its original size. The, for each image, the black point was subtracted out, the images scaled into the range [0,1], a gamma of 2.2 applied, resized to 640×480, and saved as JPEG’s.

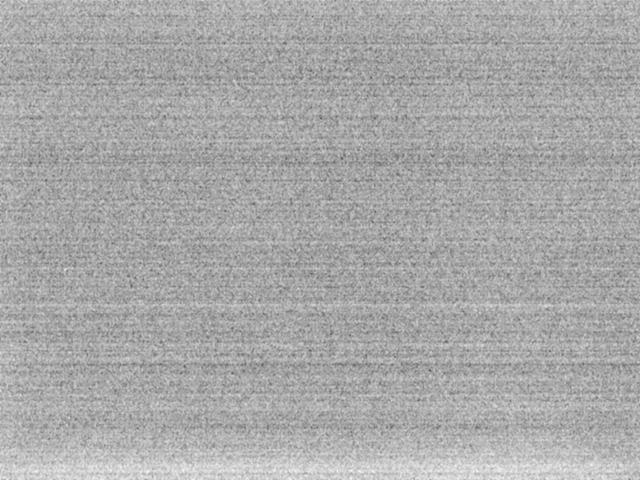
The unfiltered image:


D810ISO100lpH1

Can’t see much, can you? This illustrates how good the D810’s read noise really is, but you can’t count on leaving the shadows alone when you’re editing an image, so let’s look at the filtered images.

With a horizontal kernel of 11 pixels extent:

D810ISO100lpV11

With a vertical kernel of 11 pixels extent:

D810ISO100lpH11

With a square kernel of 11×11 pixels:

D810ISO100lp11

It’s hard to see much in the two one-dimensional kernels, and, indeed, the curves in yesterday’s post showed that they’re not too far from ideal. However, the square kernel shows that whole rows seem to vary at once.

With a horizontal kernel 216 pixels long:

D810ISO100lpV216

Not the row variation is readily apparent.

With a vertical kernel of the same size:

D810ISO100lpH216

Some column variation is evident.

With a 216×216 kernel:

D810ISO100lp216

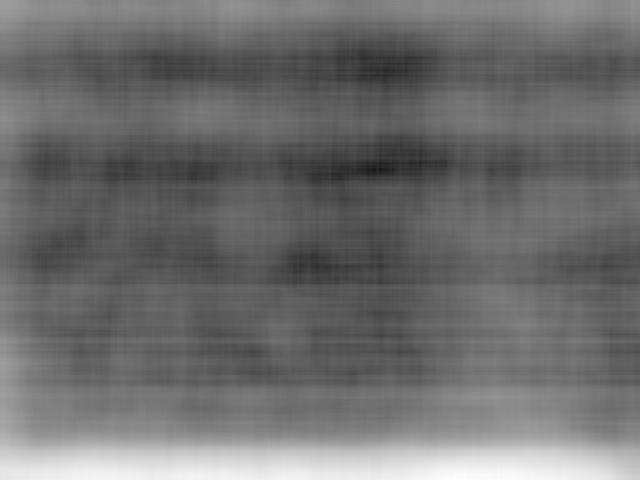
This last makes the hot spot across the bottom of the image obvious.


The Last Word

← D810 read noise quality vs ISO Sony a7S read noise analysis →

Leave a Reply Cancel reply

Your email address will not be published. Required fields are marked *

May 2025
S M T W T F S
 123
45678910
11121314151617
18192021222324
25262728293031
« Apr    

Articles

  • About
    • Patents and papers about color
    • Who am I?
  • How to…
    • Backing up photographic images
    • How to change email providers
    • How to shoot slanted edge images for me
  • Lens screening testing
    • Equipment and Software
    • Examples
      • Bad and OK 200-600 at 600
      • Excellent 180-400 zoom
      • Fair 14-30mm zoom
      • Good 100-200 mm MF zoom
      • Good 100-400 zoom
      • Good 100mm lens on P1 P45+
      • Good 120mm MF lens
      • Good 18mm FF lens
      • Good 24-105 mm FF lens
      • Good 24-70 FF zoom
      • Good 35 mm FF lens
      • Good 35-70 MF lens
      • Good 60 mm lens on IQ3-100
      • Good 63 mm MF lens
      • Good 65 mm FF lens
      • Good 85 mm FF lens
      • Good and bad 25mm FF lenses
      • Good zoom at 24 mm
      • Marginal 18mm lens
      • Marginal 35mm FF lens
      • Mildly problematic 55 mm FF lens
      • OK 16-35mm zoom
      • OK 60mm lens on P1 P45+
      • OK Sony 600mm f/4
      • Pretty good 16-35 FF zoom
      • Pretty good 90mm FF lens
      • Problematic 400 mm FF lens
      • Tilted 20 mm f/1.8 FF lens
      • Tilted 30 mm MF lens
      • Tilted 50 mm FF lens
      • Two 15mm FF lenses
    • Found a problem – now what?
    • Goals for this test
    • Minimum target distances
      • MFT
      • APS-C
      • Full frame
      • Small medium format
    • Printable Siemens Star targets
    • Target size on sensor
      • MFT
      • APS-C
      • Full frame
      • Small medium format
    • Test instructions — postproduction
    • Test instructions — reading the images
    • Test instructions – capture
    • Theory of the test
    • What’s wrong with conventional lens screening?
  • Previsualization heresy
  • Privacy Policy
  • Recommended photographic web sites
  • Using in-camera histograms for ETTR
    • Acknowledgments
    • Why ETTR?
    • Normal in-camera histograms
    • Image processing for in-camera histograms
    • Making the in-camera histogram closely represent the raw histogram
    • Shortcuts to UniWB
    • Preparing for monitor-based UniWB
    • A one-step UniWB procedure
    • The math behind the one-step method
    • Iteration using Newton’s Method

Category List

Recent Comments

  • JimK on How Sensor Noise Scales with Exposure Time
  • Štěpán Kaňa on Calculating reach for wildlife photography
  • Štěpán Kaňa on How Sensor Noise Scales with Exposure Time
  • JimK on Calculating reach for wildlife photography
  • Geofrey on Calculating reach for wildlife photography
  • JimK on Calculating reach for wildlife photography
  • Geofrey on Calculating reach for wildlife photography
  • Javier Sanchez on The 16-Bit Fallacy: Why More Isn’t Always Better in Medium Format Cameras
  • Mike MacDonald on Your photograph looks like a painting?
  • Mike MacDonald on Your photograph looks like a painting?

Archives

Copyright © 2025 · Daily Dish Pro On Genesis Framework · WordPress · Log in

Unless otherwise noted, all images copyright Jim Kasson.