the last word

Photography meets digital computer technology. Photography wins -- most of the time.

  • site home
  • blog home
  • galleries
  • contact
  • underwater
  • the bleeding edge
You are here: Home / The Last Word / D810 read noise quality vs ISO

D810 read noise quality vs ISO

October 27, 2014 JimK Leave a Comment

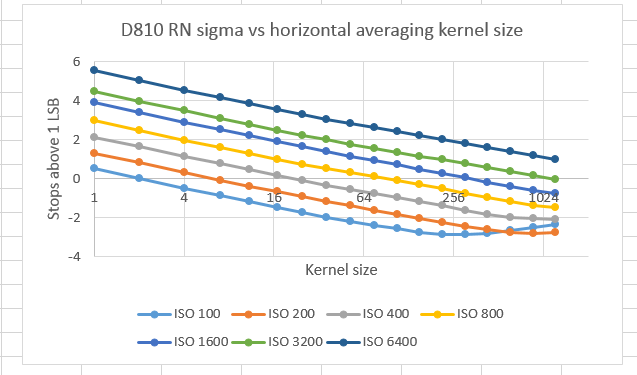
I performed the horizontal and vertical filtering operations of the previous post on D810 dark-field images from ISO 100 to ISO 6400 in whole-stop steps. Here’s the result, for horizontal kernels, which preserve vertical features:

d810rnhor

And for vertical kernels:

d810rnvert

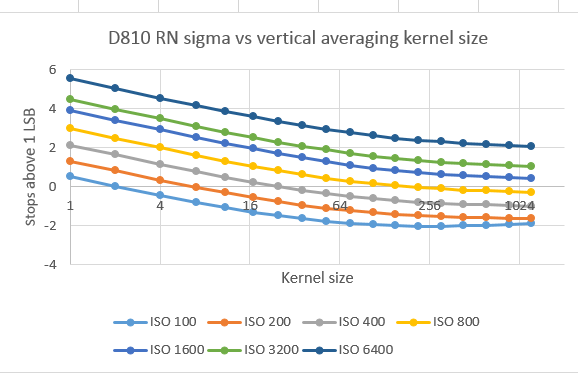
You’ll notice that the horizontal kernel results are more nearly straight lines in the log-log graphs, indicating that the read noise in the horizontal direction is more nearly white. However, in both directions, especially at low ISO’s the noise stops being white within the kernel size, and the curves flatten.

Now let’s see what the curves would look like with the  vertical axis referred to the input to the pre-ADC gain stages, so that the units are now electrons in the sensor photosites.

Vertical averaging:

d810rnvertelec

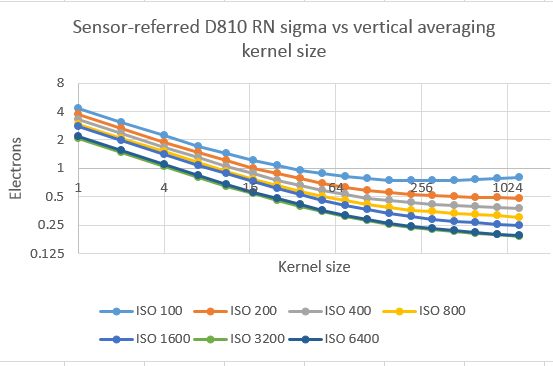
Those of you who have been looking at Sensogen or other sites reporting on D810 read noise will have noticed that the minimum values of the read noise in electrons are about twice as large as those on those sites. That’s because I am using the entire raw image for analysis, and the more usual sample for read noise is a 100×100 or 200×200 pixel block..

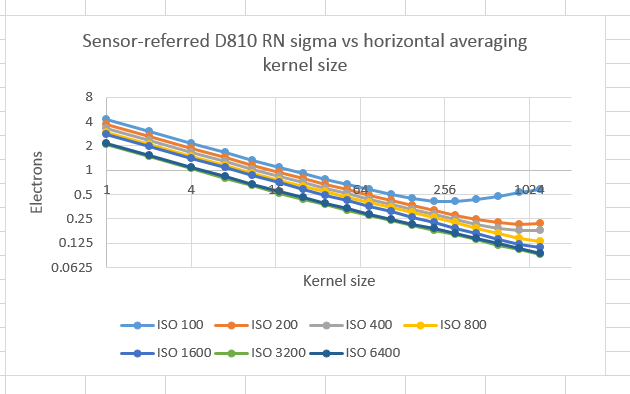
Horizontal averaging:

d810rnhorelec

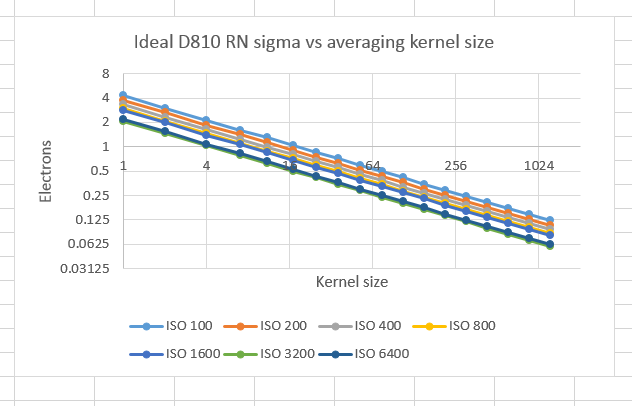
Here’s what the curves would look like if the read noise were white.

d810rnideal 
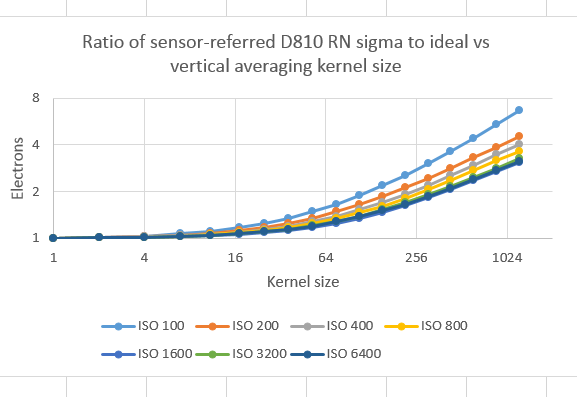
Now let’s look at the horizontally and vertically filtered curves divided by the ideal curves, to try and isolate the low-frequency weighted part of the actual read noise.

With vertical kernels:

d810rnivertvsdeal

And with horizontal kernels:

d810rnihorvsdeal

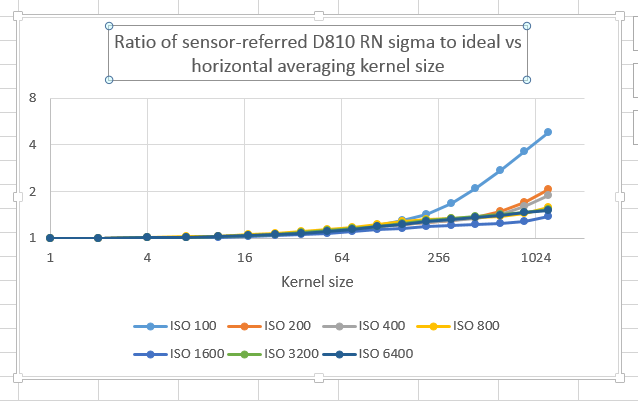
If we ignore the ISO 100 case, the low-frequency part of the horizontally-averaged curves are between one and a half and twice what they’d be with ideal noise. The numbers are about twice as bad for the vertically-averaged case.


The Last Word

← Convolution filtering and read noise D810 ISO I00 filtered dark-field images →

Leave a Reply Cancel reply

Your email address will not be published. Required fields are marked *

March 2023
S M T W T F S
 1234
567891011
12131415161718
19202122232425
262728293031  
« Jan    

Articles

  • About
    • Patents and papers about color
    • Who am I?
  • Good 35-70 MF lens
  • How to…
    • Backing up photographic images
    • How to change email providers
  • Lens screening testing
    • Equipment and Software
    • Examples
      • Bad and OK 200-600 at 600
      • Excellent 180-400 zoom
      • Fair 14-30mm zoom
      • Good 100-200 mm MF zoom
      • Good 100-400 zoom
      • Good 100mm lens on P1 P45+
      • Good 120mm MF lens
      • Good 18mm FF lens
      • Good 24-105 mm FF lens
      • Good 24-70 FF zoom
      • Good 35 mm FF lens
      • Good 60 mm lens on IQ3-100
      • Good 63 mm MF lens
      • Good 65 mm FF lens
      • Good 85 mm FF lens
      • Good and bad 25mm FF lenses
      • Good zoom at 24 mm
      • Marginal 18mm lens
      • Marginal 35mm FF lens
      • Mildly problematic 55 mm FF lens
      • OK 16-35mm zoom
      • OK 60mm lens on P1 P45+
      • OK Sony 600mm f/4
      • Pretty good 16-35 FF zoom
      • Pretty good 90mm FF lens
      • Problematic 400 mm FF lens
      • Tilted 20 mm f/1.8 FF lens
      • Tilted 30 mm MF lens
      • Tilted 50 mm FF lens
      • Two 15mm FF lenses
    • Found a problem – now what?
    • Goals for this test
    • Minimum target distances
      • MFT
      • APS-C
      • Full frame
      • Small medium format
    • Printable Siemens Star targets
    • Target size on sensor
      • MFT
      • APS-C
      • Full frame
      • Small medium format
    • Test instructions — postproduction
    • Test instructions — reading the images
    • Test instructions – capture
    • Theory of the test
    • What’s wrong with conventional lens screening?
  • Previsualization heresy
  • Privacy Policy
  • Recommended photographic web sites
  • Using in-camera histograms for ETTR
    • Acknowledgments
    • Why ETTR?
    • Normal in-camera histograms
    • Image processing for in-camera histograms
    • Making the in-camera histogram closely represent the raw histogram
    • Shortcuts to UniWB
    • Preparing for monitor-based UniWB
    • A one-step UniWB procedure
    • The math behind the one-step method
    • Iteration using Newton’s Method

Category List

Recent Comments

  • Mal Paso on Christmas tree light bokeh with the XCD 38V on the X2D
  • Sebastian on More on tilted adapters
  • JimK on On microlens size in the GFX 100 and GFX 50R/S
  • Kyle Krug on On microlens size in the GFX 100 and GFX 50R/S
  • JimK on Hasselblad X2D electronic shutter scan time
  • Jake on Hasselblad X2D electronic shutter scan time
  • Piotr Chylarecki on Who am I?
  • JimK on Who am I?
  • Piotr Chylarecki on Who am I?
  • Stefan on Swebo TC-1 OOBE

Archives

Copyright © 2023 · Daily Dish Pro On Genesis Framework · WordPress · Log in

Unless otherwise noted, all images copyright Jim Kasson.