the last word

Photography meets digital computer technology. Photography wins -- most of the time.

  • site home
  • blog home
  • galleries
  • contact
  • underwater
  • the bleeding edge
You are here: Home / The Last Word / Sony a7S read noise analysis

Sony a7S read noise analysis

October 29, 2014 By JimK Leave a Comment

Today, I’ll apply the same read noise analysis approach of the last few posts to a new camera, the Sony alpha 7S. The a7S has the — unique in my testing — ability to change its conversion gain as a function if the ISO setting. The conversion gain jumps when the ISO dial is turned from 1600 to 2000, That turns out to dramatically affect the read noise.

First, let’s look at the raw red-channel (since there’s no light falling on the sensor, it doesn’t make any difference what channel you pick) dark-field noise at 1/8000 second as a function of a horizontally-oriented 1xn averaging filter. This filter retains vertical variations, while eliminating more and more horizontal ones as the kernel size increases. The read noise in this case is the same as the dark-field noise, since the a7S does not cut off the bottom of the dark-field histogram like some cameras.

a7srnH

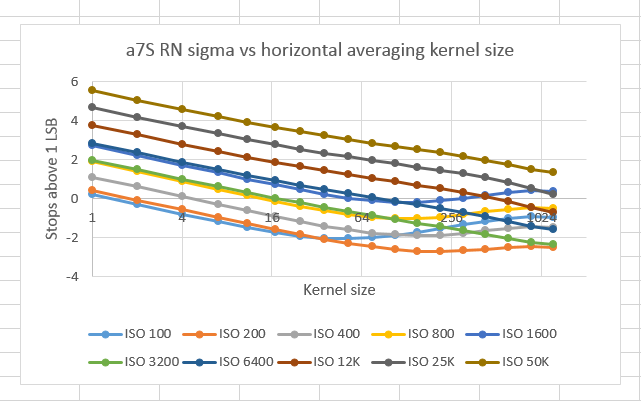
All of the curves have a positive second derivative (their slope is increasing), except for high ISO at large kernels. If the read noise were white, that wouldn’t be the case. In addition, all the plots at ISO 1600 and below, with the exception of the ISO 200 curve, have a pronounced rise in level as the kernel size increases after about 100. It’s not clear what this means, but I’ll show you the images in a future post, and maybe we can figure it out..

If we filter the image with a vertical kernel, we get this:

a7SRNV

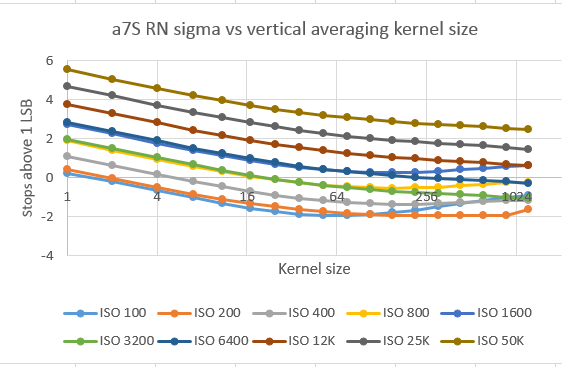
Roughly the same situation, except the systematic change of slope for all the curves is more pronounced. This means that more of the low frequency read noise is in the vertical than in the horizontal direction.

If the read noise of the a7S were white, the curves, referred to the input of the pre-ADC gain stages, would look like this:

a7sideal

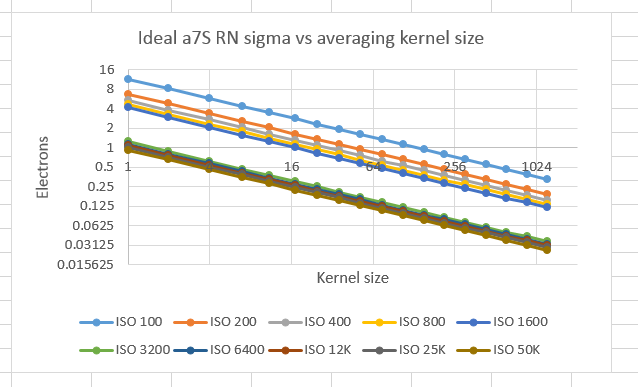
The read noise starts out as about 12 electrons at ISO 100, and comes down as ISO is increased to 1600. Then it makes a big jump at ISO 3200, and stays close to that low level as ISO is further increased. As in the immediately preceding posts, these read noise numbers are higher than others have reported, and, indeed, higher than I have previously reported, because I measured teh standard deviation of the noise across the entire sensor, not just a small square in the center.

Normalizing  the filtered curves to the ideal (white) behavior, we get the following plots:

a7svsidealH

a7svsidealV

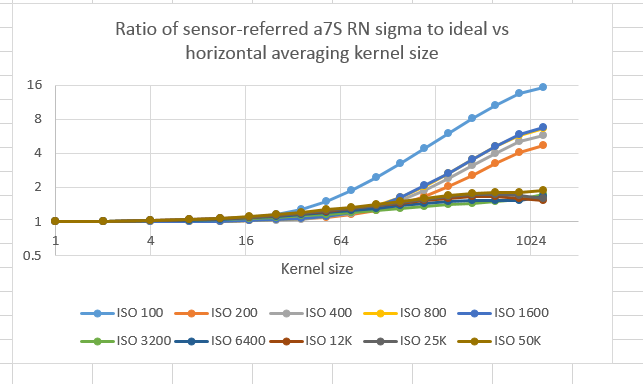
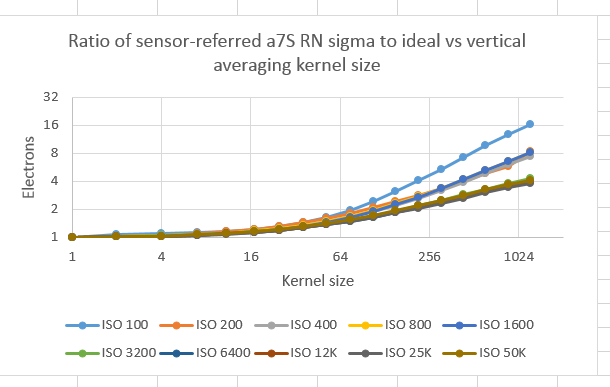
At high ISOs, the low-frequency component of the read noise raises the standard deviation by a factor of 4 for vertical averaging, and less than 2 for horizontal averaging. At lower ISOs, things get somewhat worse, with ISO 100 being an outlier.


← D810 ISO I00 filtered dark-field images Sony a7S dark-field images — ISO 100 →

Leave a Reply Cancel reply

Your email address will not be published. Required fields are marked *

January 2021
S M T W T F S
 12
3456789
10111213141516
17181920212223
24252627282930
31  
« Dec    

Articles

  • About
    • Patents and papers about color
    • Who am I?
  • How to…
    • Backing up photographic images
    • How to change email providers
  • Lens screening testing
    • Equipment and Software
    • Examples
      • Bad and OK 200-600 at 600
      • Excellent 180-400 zoom
      • Fair 14-30mm zoom
      • Good 100-200 mm MF zoom
      • Good 100-400 zoom
      • Good 100mm lens on P1 P45+
      • Good 120mm MF lens
      • Good 18mm FF lens
      • Good 24-105 mm FF lens
      • Good 24-70 FF zoom
      • Good 35 mm FF lens
      • Good 60 mm lens on IQ3-100
      • Good 63 mm MF lens
      • Good 65 mm FF lens
      • Good 85 mm FF lens
      • Good and bad 25mm FF lenses
      • Good zoom at 24 mm
      • Marginal 18mm lens
      • Marginal 35mm FF lens
      • Mildly problematic 55 mm FF lens
      • OK 16-35mm zoom
      • OK 60mm lens on P1 P45+
      • OK Sony 600mm f/4
      • Pretty good 16-35 FF zoom
      • Pretty good 90mm FF lens
      • Problematic 400 mm FF lens
      • Tilted 20 mm f/1.8 FF lens
      • Tilted 30 mm MF lens
      • Tilted 50 mm FF lens
      • Two 15mm FF lenses
    • Found a problem – now what?
    • Goals for this test
    • Minimum target distances
      • MFT
      • APS-C
      • Full frame
      • Small medium format
    • Printable Siemens Star targets
    • Target size on sensor
      • MFT
      • APS-C
      • Full frame
      • Small medium format
    • Test instructions — postproduction
    • Test instructions — reading the images
    • Test instructions – capture
    • Theory of the test
    • What’s wrong with conventional lens screening?
  • Previsualization heresy
  • Privacy Policy
  • Recommended photographic web sites
  • Using in-camera histograms for ETTR
    • Acknowledgments
    • Why ETTR?
    • Normal in-camera histograms
    • Image processing for in-camera histograms
    • Making the in-camera histogram closely represent the raw histogram
    • Shortcuts to UniWB
    • Preparing for monitor-based UniWB
    • A one-step UniWB procedure
    • The math behind the one-step method
    • Iteration using Newton’s Method

Category List

Recent Comments

  • Robert Frangioso on Leica 280/4 Apo-Telyt R on GFX 50R in infrared
  • Robert Frangioso on Why so few posts?
  • Ken on Noise reduction and downsampling
  • Robert Kuechle on Chronography video up
  • JimK on Leica 90/2 Apo-Summicron ASPH-M on GFX 50S
  • DanB on Leica 90/2 Apo-Summicron ASPH-M on GFX 50S
  • gideon on How fast is the Sony a7RIV silent shutter?
  • JimK on How fast is the Sony a7RIV silent shutter?
  • Gideon on How fast is the Sony a7RIV silent shutter?
  • JimK on How fast is the Sony a7RIV silent shutter?

Archives

Unless otherwise noted, all images copyright Jim Kasson.