Measuring read noise is useful, but by the time the image is so dark that you can see the read noise, the photon noise is usually pretty bad. For me, the photon noise is usually more important as a measure of practical image quality.
I did a variant of my usual test that shows the combined effects of photon and read noise as a function of the camera’s ISO setting.
I set up the camera aimed at a white card, and defocus the lens. The light source is a Fotodiox 5500K variable-output studio LED light, so that I am able to precisely control the light level and make series at various sensor averages. The lens is the Zeiss 135mm f/2 APO-Sonnar. I employ a Heliopan neutral density filter to reduce the light level. I start out at f/8, 1/250 second, and ISO 64, and adjust the light level to get the green channel about six stops down from full scale. I make 16 photographs of the out-of-focus card. Then I crank in a stop of attenuation with the ND filter and double the ISO setting. 16 more images. When I run out of attenuation on the ND filter, I cut the Fotodiox power in half as a I double the ISO. I stop atISO 8000.
As I said, I make 16 exposures for each data point, averaging the results from those exposures. As a side benefit of that approach, I can compute the standard deviation of the underlying single-exposure data for each data point, and plot that information on the graphs to give an idea of the possible sampling errors involved.
I bring one of the images into RawDigger, select a square in the middle that’s 200 pixels on a side, measure the mean and standard deviation of all four sets of pixels. I leave the selection where it was, and measure the same statistics for all the rest of the images. For each image, I compute the SNR; the mean is the signal, the standard deviation is the noise.
I normalize all of the data so that they are corrected for the actual exposure of the test images, as measured by the mean value of the pixels in the selection box. This calibrates out exposure variations caused by inaccuracies in the shutter and the aperture, gain of the amplifiers in the camera, and variations in strobe brightness caused by power line variation and recycling interval.
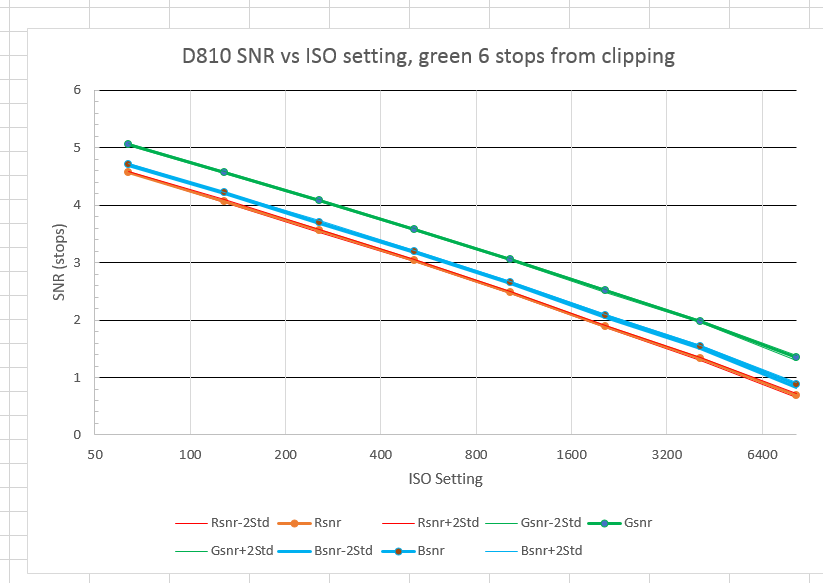
Here’s the result:
You can see the shadow signal-to-noise ration (and six stops down from full scale is usually a deepish shadow) falling as the ISO is raised. In a system that’s limited by photon noise but ideal otherwise, the slope of this falloff would be half a stop of SNR lost for each stop of ISO gained. If we subtract that out, here’s what we get:
You can see that we don’t get any improvement in corrected SNR by cranking up the ISO. In fact, we get a small loss.
This is different from what we saw looking at read noise two posts ago, where we got more than a stop of improvement by increasing the ISO setting.
What’s this all mean? It means that at normal scene dynamic ranges, there’s not much point in creasing the ISO from 64. You might as well push in post. In very wide dynamic range scenes, where read noise becomes important, turning up the ISO to as high as 5000 may help.


Leave a Reply