Here are the images from the preceding post. As usual in this read noise analysis series, they have been scaled into the range [0,1], have had a gamma curve of 2.2 applied , been res’d down to 640×480, and JPEG’d.
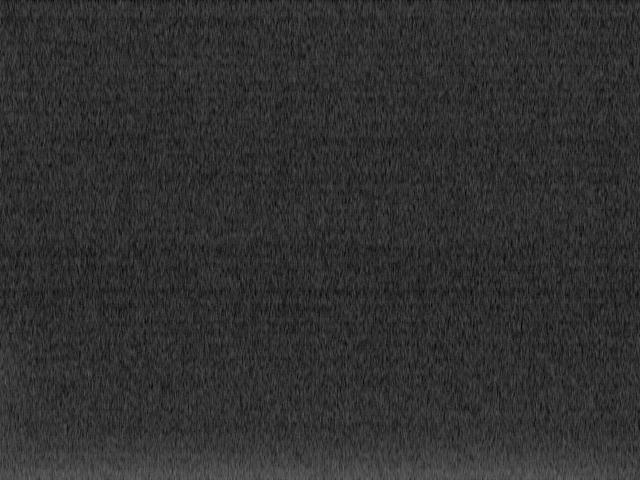
First at ISO 100 with no filtering:
Hot pixels dominate the normalization, driving the typical values of the image to virtually black.
Next, with our triplet of filters set to 25 pixels:

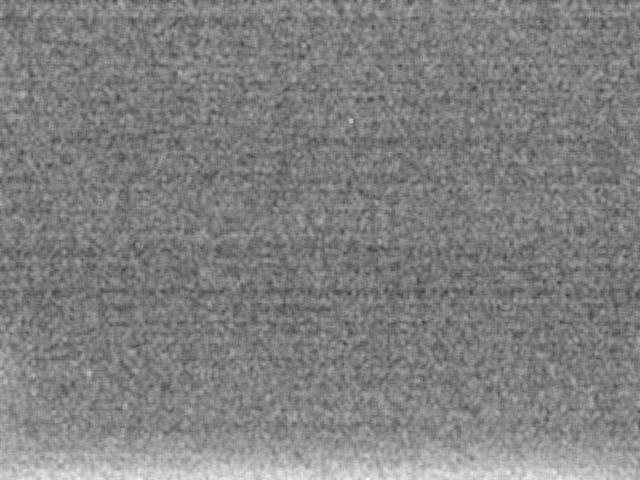
Just as predicted by the curves in the preceding post, the mid-frequency features are mostly horizontal.
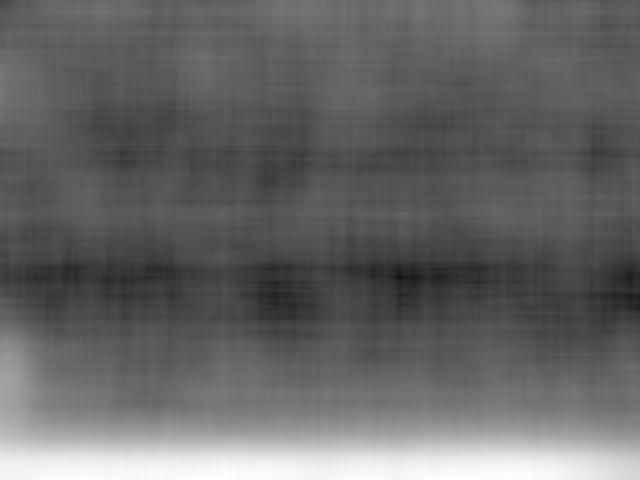
With a set of bigger kernels:


At ISO 1600, unfiltered:

With the 25-pixel filters:
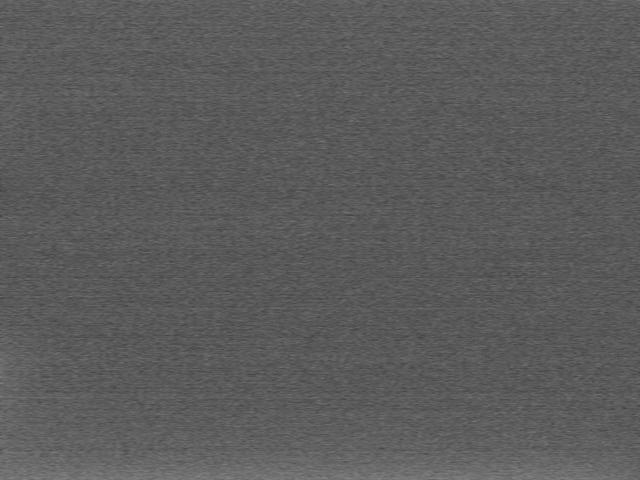
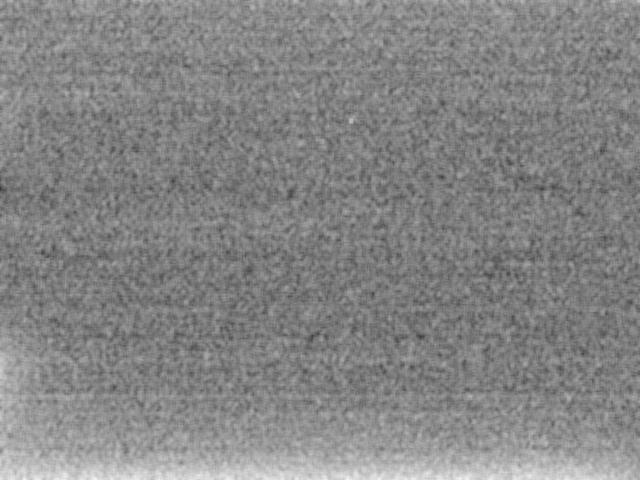
The mid-frequency horizontal components aren’t as strong at ISO 1600.
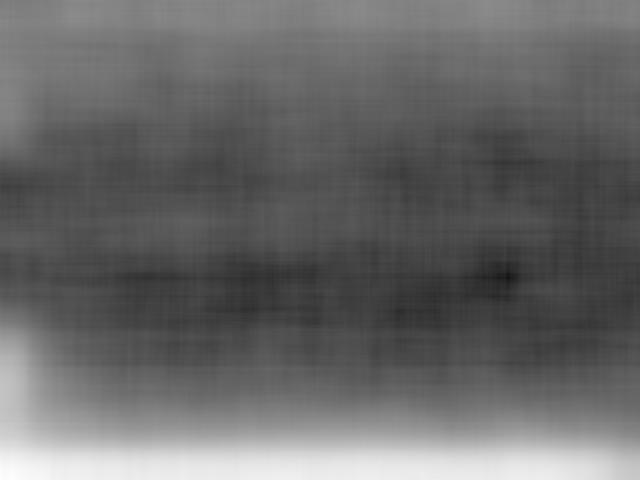
With a set of 306-pixel filters:



Leave a Reply