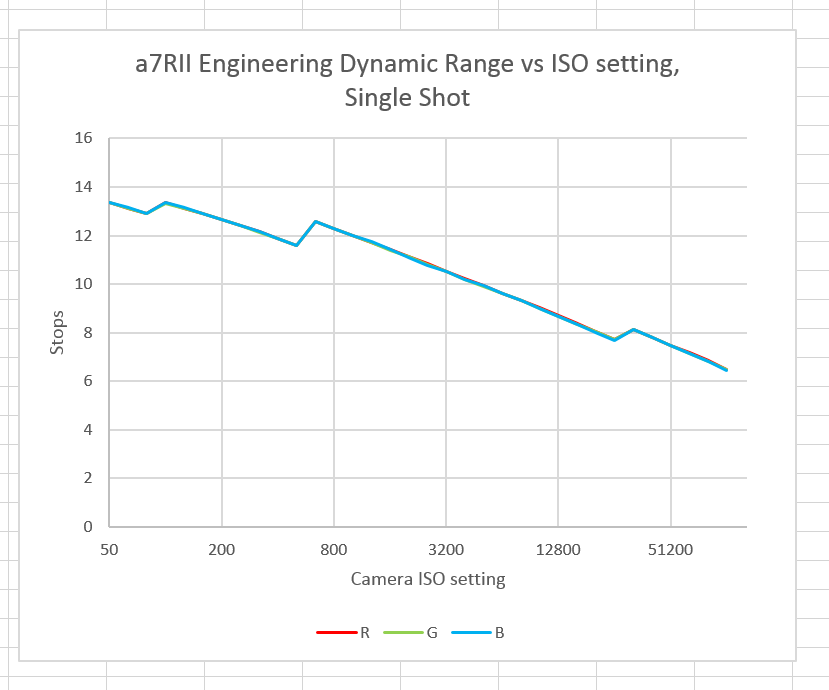
I just got my first a7RII an hour ago, and one of the first things I did was measure the engineering dynamic range (EDR) versus ISO setting with the shutter in single shot mode, silent shutter turned off. Yeah, I know; normal people would go take pictures with their new camera. Not me, though; I’ve got to wring it out first. Anyway, there was a big surprise in store for me:
Let me explain what may be going on with the bumps.
The first one, which happens when the ISO knob is turned from 80 to 100, is the camera switching from “fake” ISO to real ISO mode and the EDR getting back to the base ISO value which it also had at ISO 50.
The second one, which happens when the ISO knob is turned from 500 to 640, looks like the one that happens when the ISO knob is turned from 1600 to 2000 on the a7S. That is widely believe to be the sensor changing the conversion gain a la the Aptina patent that Sony licensed several years ago. Could it be that Sony is using the same technology on this new sensor? It will take more testing to scope this out.
The third one, which happens when the ISO knob is turned from about 25000 to 3200, looks like the one that happens at a higher ISO on the a7S, and in that case is cause by spatial filtering.I can run some Fourier analyses to find out if that is what’s going on here.
My face will be red if this turns out to me a measurement error on my part, and I usually do more checking before I post, but I thought this to be sufficiently surprising that it would be good to get more people making measurements.
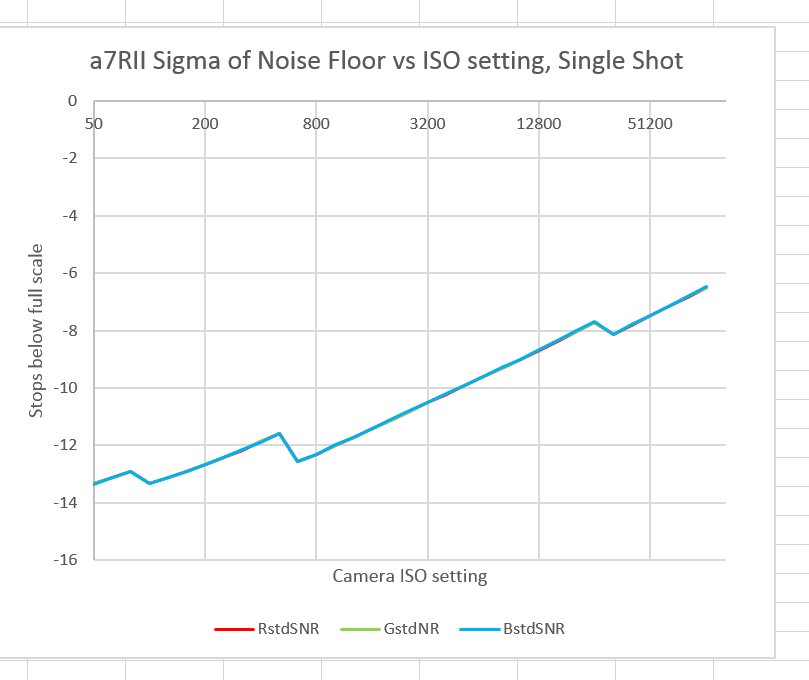
Another way of looking at the same data is to look at the noise floor as a ratio to full scale:
You might ask how I got the data. I made a series of dark-field photographs in single-shot mode at 1/2000 second at all possible camera ISO settings. I brought the files into RawDigger, selected a 400×400 pixel central area, and noted the standard deviation at each ISO. Since the a7RII, like other alpha 7 cameras, does not clip dark values, registering nominal black as a 14 bit count of 512, this is an easy way to measure the read noise.


This rusty engineer can’t tell if the charts are good, bad, or about the same compared to the “benchmarks” of the a7r / Nikon 810.
Have you been able to find time to supply test captures to Bill Claff of his DR_Grid for him to calculate his PDR values?
Do the preliminary results meet, exceed, or fall short of your expectations? Too soon to tell?
Is dynamic range really so poor for this hyped new sensor!
In best case you got under 14 steps only!
This is a very good result for a 42 MP sensor. Add 1.2 stops to get the 8MP equivalent.
Jim
The Sony a7r has over 14 steps measured by dxo with the old sensor design.
Everybody writes the A7rII has so much headroom in the
Highlights! I can’t see that big difference!
Although one could have hoped for better eDR, I believe Eric Fossum mentioned that eDR is more of a challenge in BSI implementations, so this looks like a very good result – as is the choice of 13 bit conversion at base ISO.
Jack, I think these are very good numbers for a 42 MP sensor. And the magic at ISO 640 is a big bonus.
Good work Jim. Are we just looking at the blue curve because it overlays R and G?
Yep.
Hm, how much DR a7rII has is not so easy to find out. If you use imatest and another lens, you will have other result. If you use RAW-Digger you will have other result. If you use …… you will have other result.
DR is not an issue now-a-day! For printing 8 stops is enough.
Much interesting is the bit-rate by recording. 12, 14 or 16bit. With 16bit I have more tonal-range in color and it gives me more flexibilty by post-processing.
And what about the highlights? ….. If you compare the a7rII with D810 you will see a hugh difference in tonal-range and highlight recovery…. Why?……
What you’re saying makes no sense to me. I get the same results for dark-field exposures whether I attach a lens or not. I’m careful to use a central area so that non-defeatable lens corrections don’t screw up the results.
I also get the same results with RawDigger and DCRAW.
There’s a huge difference between an 8 bits per channel gamma compressed final file and a 8 bit linear, native camera color space file that needs to be edited.
The highlights are the reference point. They should be the same place in any comparison, and shadow noise computed wrt those values.
Jim
The A7Rii meters differently than the A7R and the 5DSr. I spot metered on a gray card and my exposures were 2/3 of a stop brighter than the A7R and 5DSr (at base ISO)
Thanks. There is not much standardization as to the way cameras meter. I don’t use the meter for these tests. If your point is that the ISO setting the camera manufacturer chooses for calibration is also not standardized, it is an excellent point. There are ways around this in testing, but I’m not using any of them. Thus, the results need to be taken with a grain of salt.
That’s interesting – and unusual that meters on cameras of similar generations/quality by the same manufacturer would behave differently. Are you setting up the camera in manual, spot meter mode and ‘Neutral’ profile when performing these tests?
Hello
Your blog is one of the most informative ones. Thanks for it.
Have you compared the A7RII EDR to that of the D810?
Yes.
http://blog.kasson.com/?p=11168
Jim
That’s great. It shows that from ISO 640 on, the A7RII pulls ahead. I have just one question. Is it with the Sony lossy RAW into consideration? In other words, is it truly useable? Let’s say we have shot a high contrast scene in the same lighting with these cameras and push shadows in post. Is the A7RII final image cleaner than that of the D810 at ISO 640 and above or we will see artifacts in high contrast parts in the image shot by the A7RII due to the lossy RAW?
It’s controversial, but my opinion is that, while I’d like to see lossless compression from Sony, the present scheme does not cause visible problems for the vast majority of photographs. I don’t worry about it when I use the alpha 7 cameras.
http://blog.kasson.com/?s=sony+raw+compression
Jim
As a practical matter, at which ISOs do you suspect you will shoot?
100 for base, but is there a practical advantage shooting 640 vs 500 based on what you show?
100, and 640 mostly.
About a stop lower read noise.
Jim
Regarding the ISO 500/640 “notch” …
I infer you feel this is an advantage, at least potentially, rather than a glitch to be worked around. Correct?
Is the net effect like getting several “native base ISO’s”?
An aside: I’ve been making some captures for Bill Claff and his PDR calculations. I’m getting unexpected results when using “Silent Shutter” on his DR_Grid.jpg image … odd banding. Instead of the 7 bands of pink’ish rectangles, there seem to be about 30 bands (using Sony 28mm f2 FE lens).
The images for Mechanical Shutter and EFCS seem “as expected”. I suppose it could be some kind of interaction with the Dell IPS Adobe-98 monitor.
Absolutely! I don’t see how you can take it any other way.
Yes.
See my silent shutter timing tests.