• site home
  • blog home
  • galleries
  • contact
  • underwater
  • the bleeding edge

the last word

Photography meets digital computer technology. Photography wins -- most of the time.

You are here: Home / The Last Word / Sony a7S RN vs ISO corrected for amplifier gain

Sony a7S RN vs ISO corrected for amplifier gain

July 7, 2014 JimK Leave a Comment

There’s a way to look at read noise vs ISO setting that’s different than the curves I presented in yesterday’s post. It’s a bit less intuitive, but, if you can get your head around it, it can give useful insight into how the sensor works. Rather than presenting the standard deviation of the noise in the raw file, this alternative presentation calculates what the noise must be at the input to the pre-ADC amplifier, assuming that its gain is proportional to ISO. You have to pick one ISO to be the one that’s uncorrected, and I picked ISO 100, the camera’s base ISO.

For a completely “ISO-less” camera, the corrected curve would be a flat horizontal line.

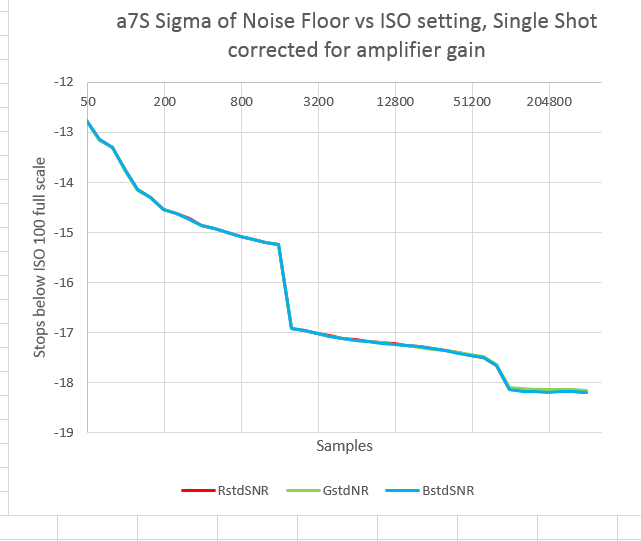
Here’s the corrected curve with the drive in single shot mode:

RNvsISOSSCorr

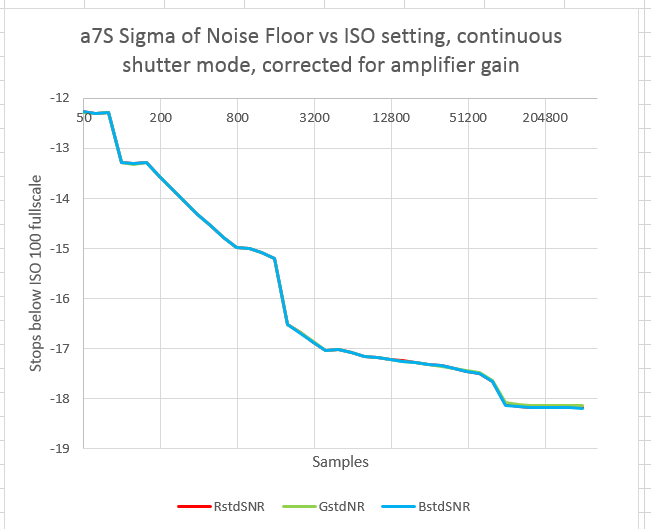
With the drive in continuous mode:

RNvsISOContCorr

And finally, with the drive in single shot mode and silent shutter invoked:

RNvsISOSilentCorr


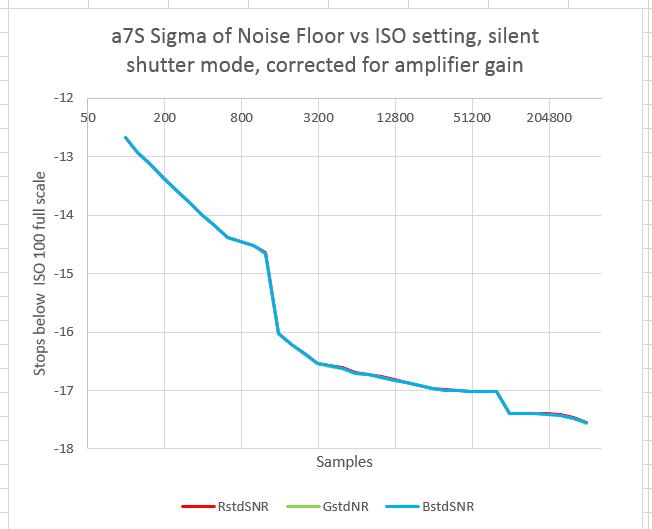
In all three curves the pattern is the same. The read noise falls early on, giving the impression that it’s approaching an asymptote around ISO 1600, then falls precipitously again, as (I assume) the conversion gain is lowered. It then falls slowly, approaching an asymptote at ISO 100K, only to see a sudden drop again. After the second drop, the camera appears to be ISO-less with respect to read noise.

You often see curves like this with the vertical axis being electrons. To make those curves requires knowing the Unity Gain ISO. I haven’t measured that yet, so my vertical axis is stops down from full scale when the camera is set to ISO 100.

In the Aptina white paper, the example they use of the switched-conversion-gain technique changes the gain by a factor of four. That would produce a 2-stop drop at the ISO point where the gain switch occurred, which is just a little more  than what we see in the graphs above.

The Last Word

← Sony a7S read noise vs shutter speed. Zeiss 35mm f/2 Biogon ZM on the a7S →

Leave a Reply Cancel reply

Your email address will not be published. Required fields are marked *

May 2025
S M T W T F S
 123
45678910
11121314151617
18192021222324
25262728293031
« Apr    

Articles

  • About
    • Patents and papers about color
    • Who am I?
  • How to…
    • Backing up photographic images
    • How to change email providers
    • How to shoot slanted edge images for me
  • Lens screening testing
    • Equipment and Software
    • Examples
      • Bad and OK 200-600 at 600
      • Excellent 180-400 zoom
      • Fair 14-30mm zoom
      • Good 100-200 mm MF zoom
      • Good 100-400 zoom
      • Good 100mm lens on P1 P45+
      • Good 120mm MF lens
      • Good 18mm FF lens
      • Good 24-105 mm FF lens
      • Good 24-70 FF zoom
      • Good 35 mm FF lens
      • Good 35-70 MF lens
      • Good 60 mm lens on IQ3-100
      • Good 63 mm MF lens
      • Good 65 mm FF lens
      • Good 85 mm FF lens
      • Good and bad 25mm FF lenses
      • Good zoom at 24 mm
      • Marginal 18mm lens
      • Marginal 35mm FF lens
      • Mildly problematic 55 mm FF lens
      • OK 16-35mm zoom
      • OK 60mm lens on P1 P45+
      • OK Sony 600mm f/4
      • Pretty good 16-35 FF zoom
      • Pretty good 90mm FF lens
      • Problematic 400 mm FF lens
      • Tilted 20 mm f/1.8 FF lens
      • Tilted 30 mm MF lens
      • Tilted 50 mm FF lens
      • Two 15mm FF lenses
    • Found a problem – now what?
    • Goals for this test
    • Minimum target distances
      • MFT
      • APS-C
      • Full frame
      • Small medium format
    • Printable Siemens Star targets
    • Target size on sensor
      • MFT
      • APS-C
      • Full frame
      • Small medium format
    • Test instructions — postproduction
    • Test instructions — reading the images
    • Test instructions – capture
    • Theory of the test
    • What’s wrong with conventional lens screening?
  • Previsualization heresy
  • Privacy Policy
  • Recommended photographic web sites
  • Using in-camera histograms for ETTR
    • Acknowledgments
    • Why ETTR?
    • Normal in-camera histograms
    • Image processing for in-camera histograms
    • Making the in-camera histogram closely represent the raw histogram
    • Shortcuts to UniWB
    • Preparing for monitor-based UniWB
    • A one-step UniWB procedure
    • The math behind the one-step method
    • Iteration using Newton’s Method

Category List

Recent Comments

  • JimK on How Sensor Noise Scales with Exposure Time
  • Štěpán Kaňa on Calculating reach for wildlife photography
  • Štěpán Kaňa on How Sensor Noise Scales with Exposure Time
  • JimK on Calculating reach for wildlife photography
  • Geofrey on Calculating reach for wildlife photography
  • JimK on Calculating reach for wildlife photography
  • Geofrey on Calculating reach for wildlife photography
  • Javier Sanchez on The 16-Bit Fallacy: Why More Isn’t Always Better in Medium Format Cameras
  • Mike MacDonald on Your photograph looks like a painting?
  • Mike MacDonald on Your photograph looks like a painting?

Archives

Copyright © 2025 · Daily Dish Pro On Genesis Framework · WordPress · Log in

Unless otherwise noted, all images copyright Jim Kasson.