This is the 28th in a series of posts on the Fujifilm GFX-50S. The series starts here.
A while back, I developed a protocol for measuring focus shift and longitudinal chromatic aberration (LoCA). I’ve improved it over the last year or so, but it’s still the same idea, as described here:
I should note that I could not find a version of dcraw that could read the GFX raw files, so I converted them to DNG using Adobe’s DNG converter.
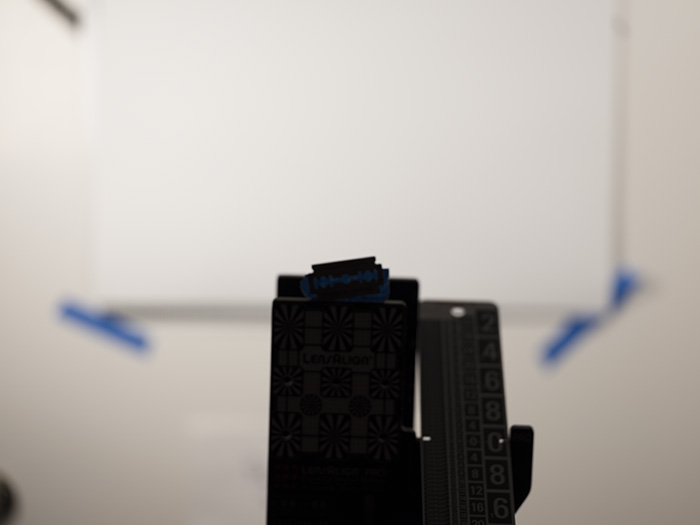
I set up the Fujifilm GFX-50S on the Cognisys rail so that the lens was 1 meter from the razor blade target.
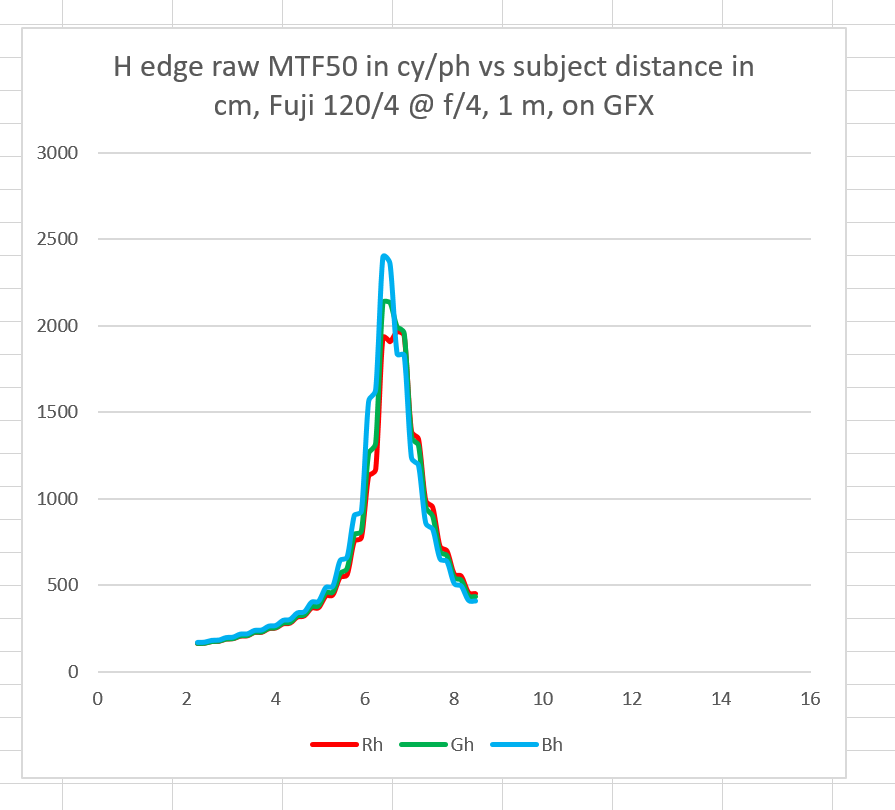
At f/4, the MTF50 measured in cycles/picture height versus subject distance graph looks like this:
The reason this curve looks stair-steppy is that, for reasons that I don’t understand the camera made two exposures per position. Thus, you should look at the left side of the step if you want to look for focus shift with respect to the curves that follow. For those curves, the camera made one exposure per step, just as I was trying to do all along. I may redo these curves ni the future. There isn’t much depth of field (DOF) at all, even though I tightened up on the step size for the f/4 image. There isn’t much LoCA, as the peak sharpness distance for all three raw color planes are about the same.
And it’s so sharp! I’ve not seen that kind of sharpness from analyzing raw planes. But then again I’ve never looked at a camera with a pitch this large and so many pixels from top to bottom, plus a deliberately small microlens. I should mention that the aspect ratio of the GFX gives it a leg up in cycles/picture height versus a FF camera.
If we look at the Imatest analysis of the sharpest f/4 image demosaiced with the dcraw and the standard Imatest command string, we get an idea of what’s going on.
You can see that dcraw is doing a little sharpening in the demosaicing. Imatest still calls the image undersharpened by more than 20%. You can also see that there’s going to be a lot of aliasing with this lens on this camera; the MTF at Nyquist is about a quarter. The Imatest-estimated combined MTF50 of a bit over 2000 cy/ph is in line with the raw green channel measurement that I made with MTF Mapper, but that could easily be a coincidence, given the large number of differences between the two calculations.
If we look at Imatest’s take on the green raw channel, it looks like this:
The reason that the MTF curve looks so strange is that there are half as many pixels in each direction in any particular raw channel, and thus Nyquist drops be a factor of two. If you want to mentally divide the units of the horizontal axis by two, feel free to do so.
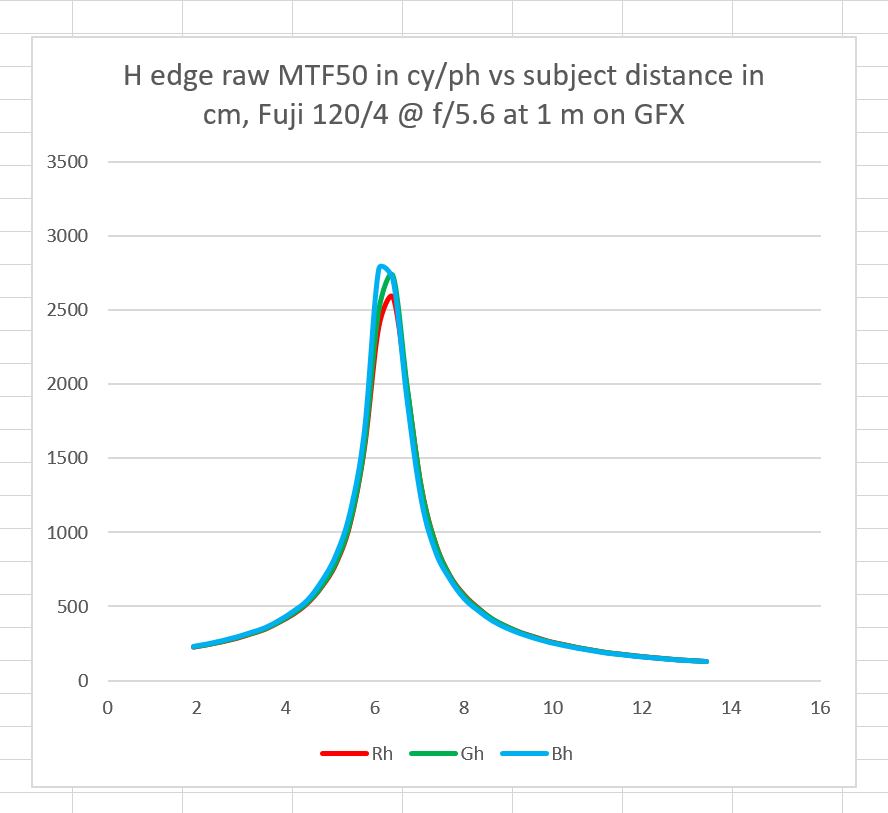
At f/5.6, things get even better:
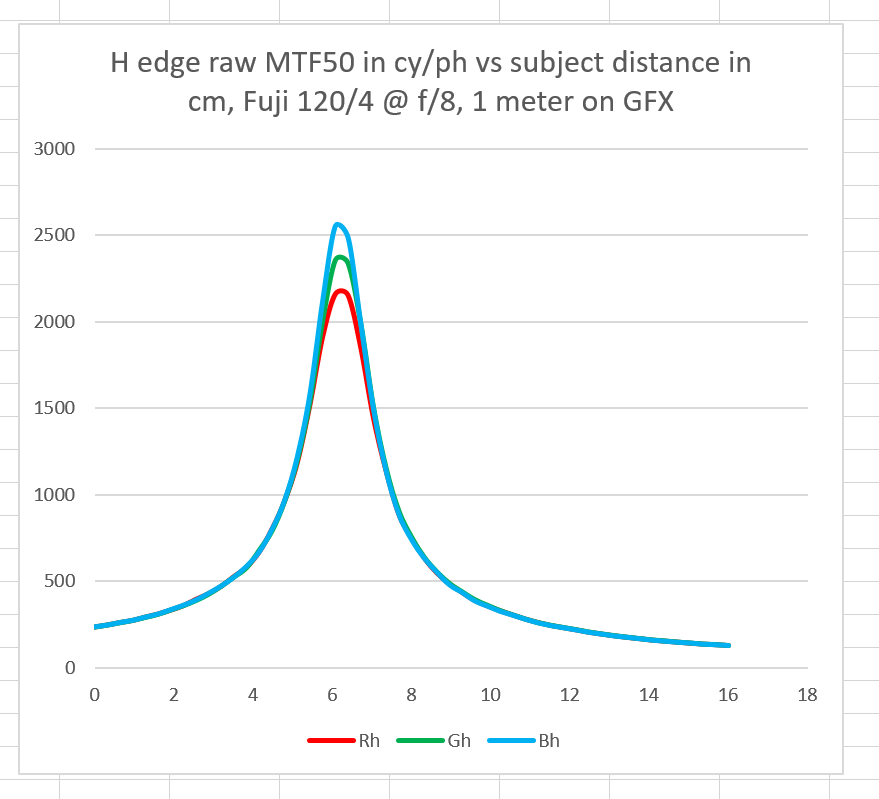
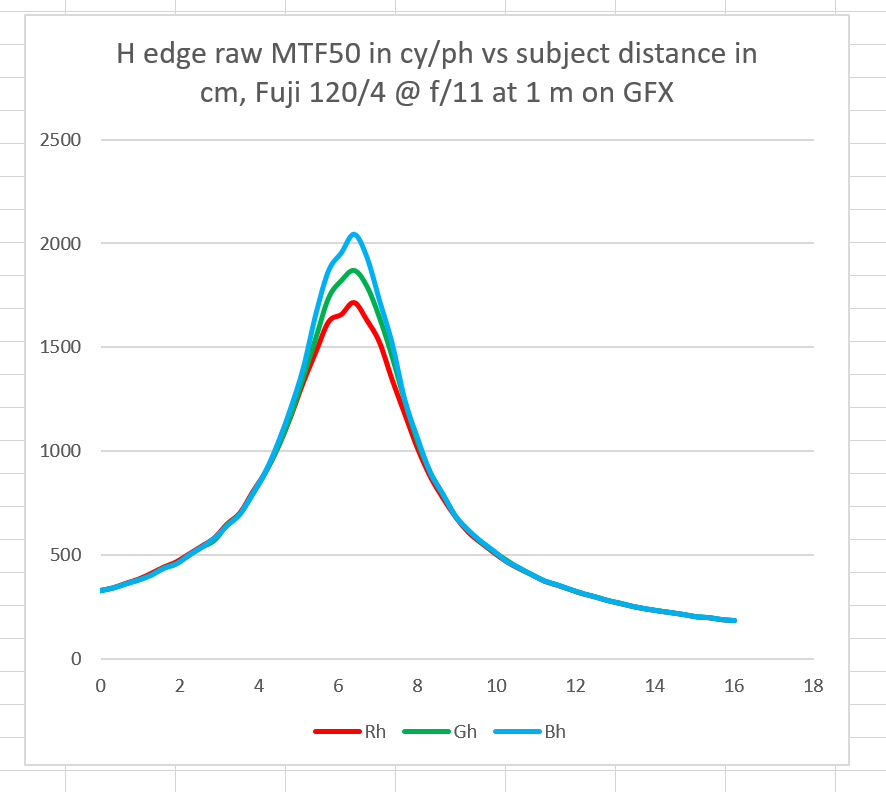
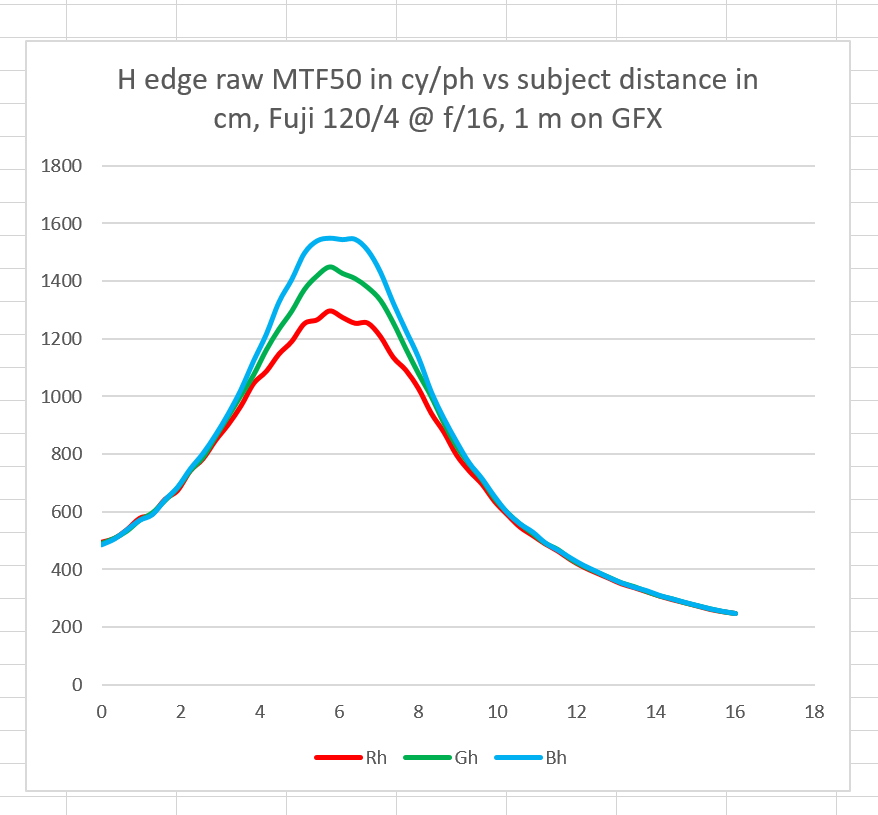
It turns out that f/5.6 is the sharpest whole stop, with f/8 coming in second. I’ll just show you the rest in a group:
Really impressive!
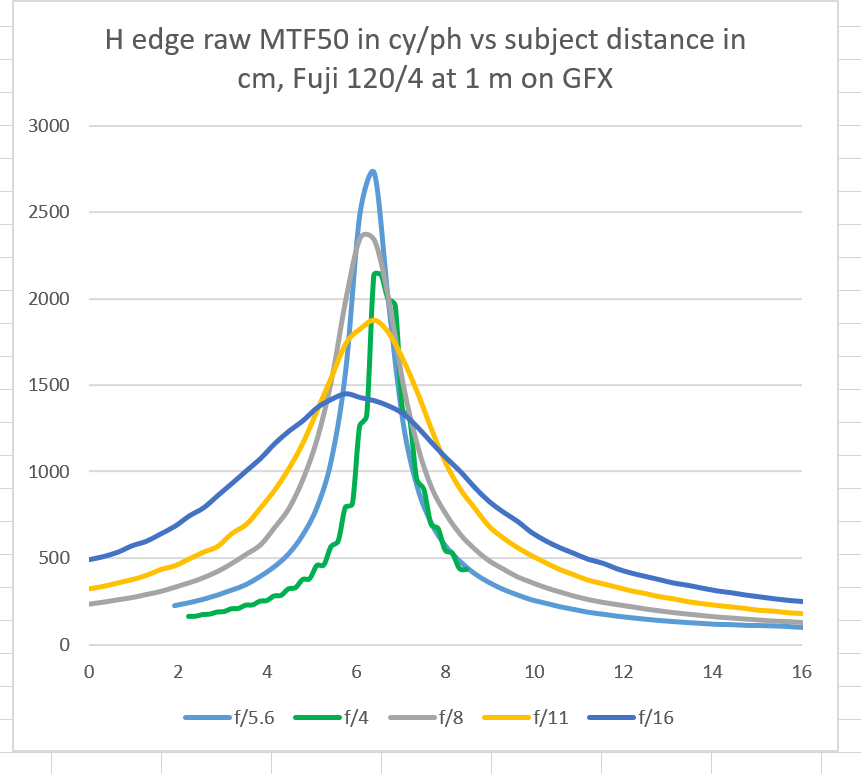
If we plot the results for the green raw channel in the same graph, we can look at focus shift:
If you look at the average of the green curve, remember that it should be shifted half a step to the left. There is some focus shift, but it’s not bad. Still, you would do well to focus this lens at the taking aperture.


Jack Hogan says
Very impressive, virtually no Longitudinal CA.