This is one in a series of posts on the Fujifilm GFX 100S. You should be able to find all the posts about that camera in the Category List on the right sidebar, below the Articles widget. There’s a drop-down menu there that you can use to get to all the posts in this series; just look for “GFX 100S”.
A few days ago, I wrote a post comparing the Fuji 250/4 against the Rodenstock 180/5.6 HR Digaron on a GFX 100S. After that post, several people suggested that I might have a bad copy of the 250/4 GF. Someone on DPR said that he thought his 250/4 was about as sharp in the image field (my characterization) as his other GF lenses. He posted some Siemens star images, which I found intriguing, but inconclusive. Yesterday he sent me the results of some slanted edge testing that he had performed on his GF lenses (he used MTF Mapper for the analysis), which seemed to bear out his assertion about the relative sharpness of the 250/4. I asked for the raw file for the 250/4 shot, and he obliged.
There were some possibly material differences from my test conditions:
- I used a low contrast target; he used a high contrast one.
- I used a GFX 100S; he used a GFX 50R.
- I used natural diffused sky light; I don’t know what he used.
- I used a matte target; I don’t know what kind of substrate he used.
- He used 15 meters for the target distance; I used about 25 meters.
If he used an F-surface target, those last two might cancel each other out.
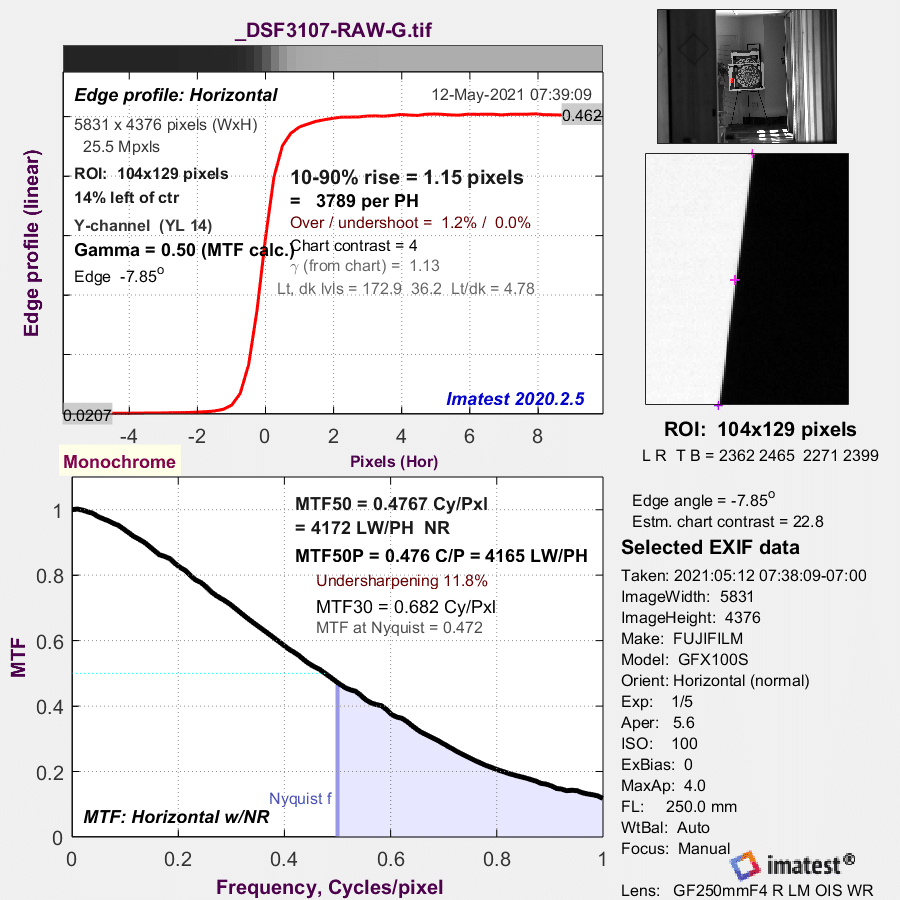
Here’s an Imatest STF analysis of his test shot:
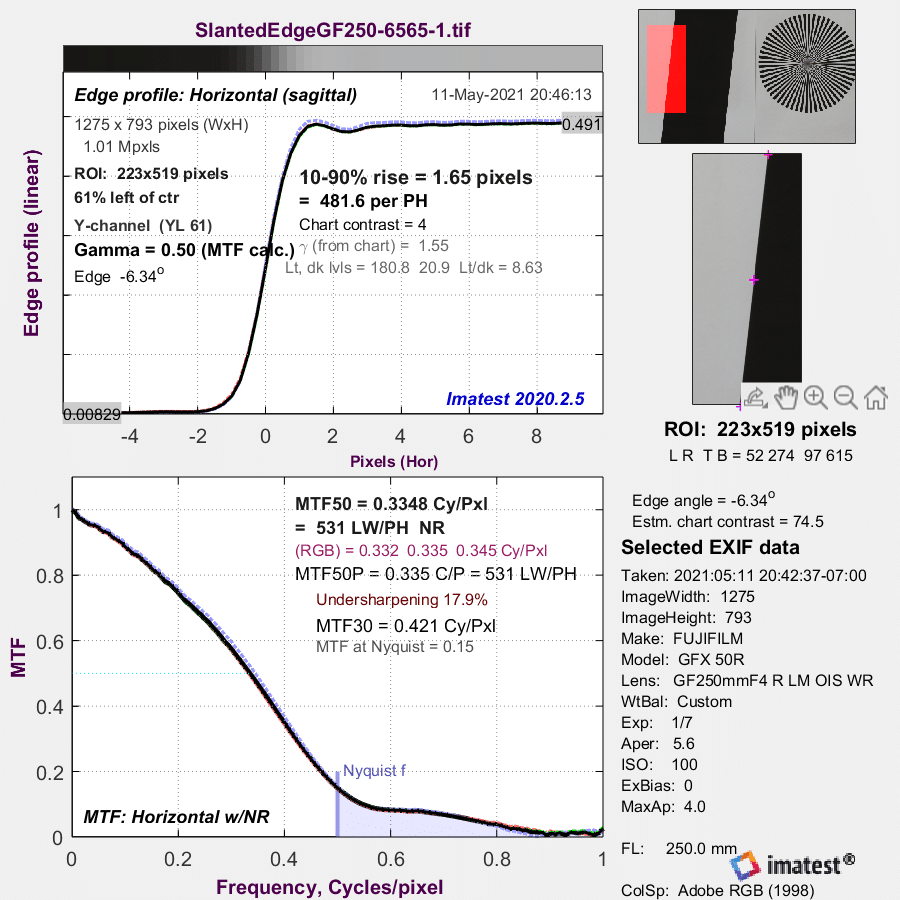
And here’s a similar analysis of my shot:
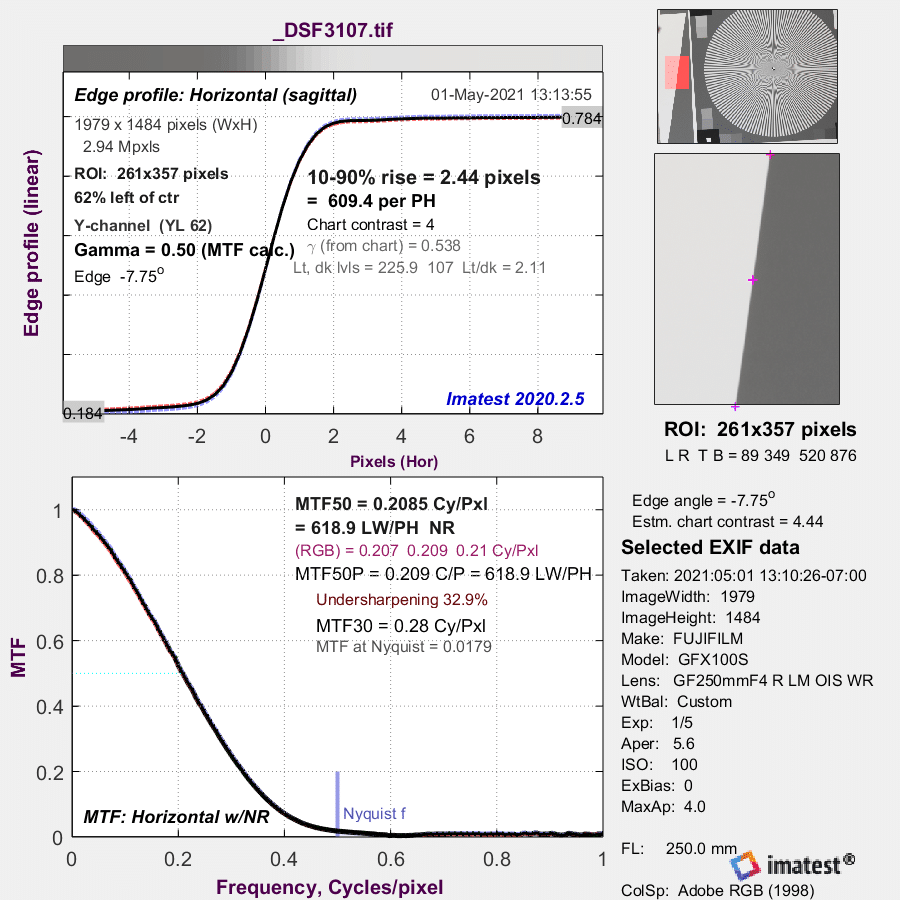
There is quite a bit of overshoot on his edge profile. That shouldn’t happen with sharpening turned off. Lightroom has performed some behind-the-scenes sharpening for some cameras in the past; is it doing that for the GFX 50R?
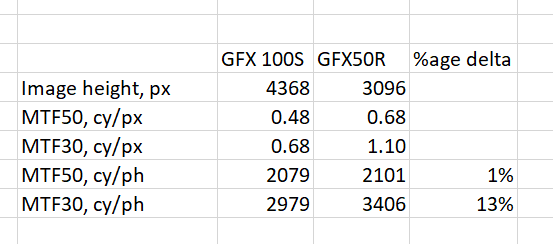
A big difference is the pixel pitch. We can correct for that mathematically by converting to cycles per picture height.
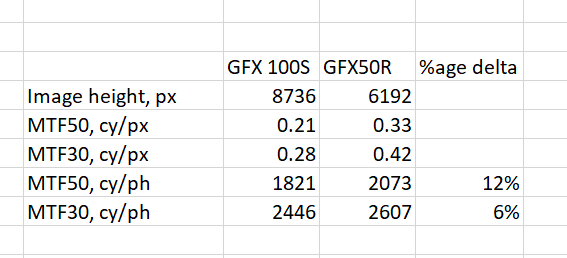
There is a 12% difference in MTf50 and a 5% difference in MTF 30. The microlenses on the two cameras are about the same size, so the loss in sharpness due to pixel aperture should be about the same.
As a way to track down the overshoot, I extracted the G1 raw channel from each raw file, and analyzed that.
With the GFX 50R:
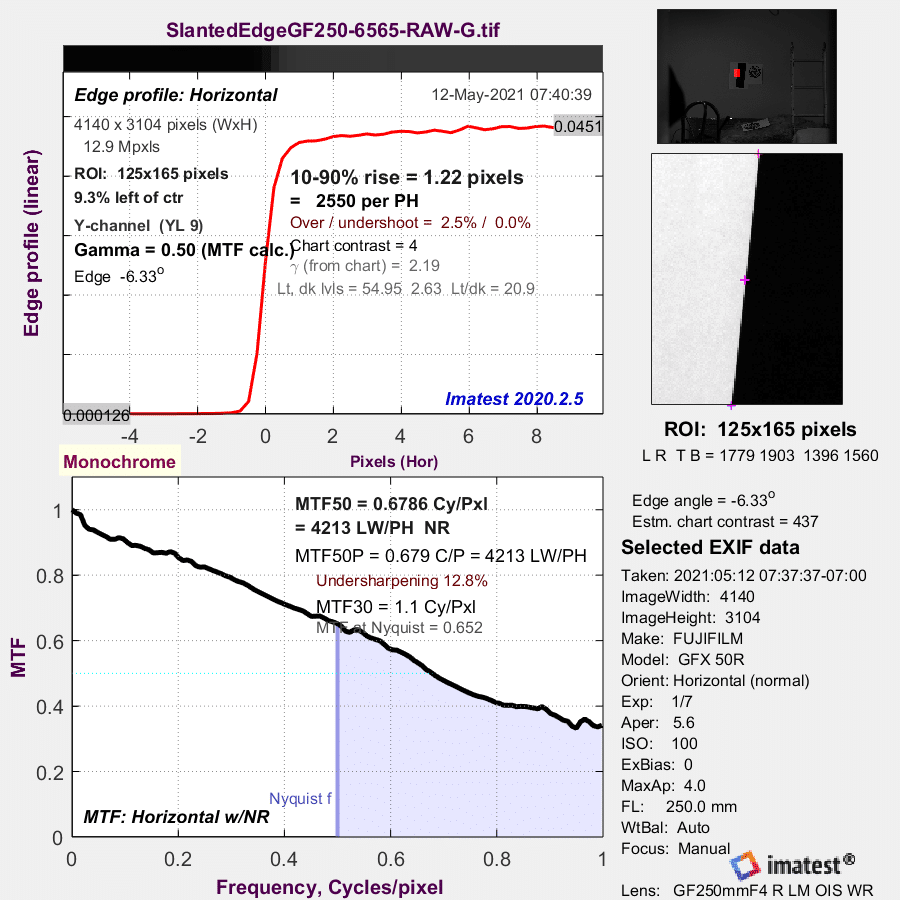
The overshoot is gone! Shame on you, Lightroom.
And with the GFX 100S:
Because 1/4 of the pixels are used, the Nyquist frequency and cycles/pixel are twice what they would be for the full image. I will correct for that mathematically.
Now the MTF50 values in cy/ph are essentially on top of each other, but the MTF 30 values are a bit further apart. I did notice when I was comparing the microlens sizes of the GFX 50S and GFX 100 that The GFX 50S did tend to be a bit sharper at high spatial frequencies.
I think that, based on this test, there is little difference between our two copies of the Fuji 250 mm f/4 GF lens.
Jack Hogan says
I seem to recall that Fuji had designed a smaller pixel aperture than normal in the GFX 50S, similar to what Nikon did with the Z7. This would indeed increase energy at higher frequencies at the expense of more aliasing.
Dimy says
Interesting test with just a sharp B&W line Print-out hor. and vert. I used to apply to digital cameras in stores in the 90ties on my own. Later I got to use standards for proper measurements.
Suggestion:
1. Swap your lenses and do the same test if you need to evaluate differences.
2. Why can’t you state in lp/mm since you know the pixel pitch of both sensors?
JimK says
That involves shipping lenses back and forth. Insurance, time, possible damage, trust…
I used cycles per picture height, since that’s more useful to most photographers. If you prefer lp/mm, the sensor is 33 mm high, so divide lp/ph by 33 to get lp/mm.
Dimy says
Please let me understand why is lp/ph more useful then lp/mm to you?
The 50R has a different pixel pitch that the 100S but ALL existing lenses have a much worse MTF50 resolution than ANY sensor beyond Nyquist-Shannon, even if you take the Bayer-Pattern into account.
I stumble often over these kind of results but In my experience the MTF is a function of the lens alone and must not be dependent of the sensor used!
Kind regards
JimK says
If the lens has worse extinction resolution than the sensor, the sensor won’t alias. But decent lenses at optimum aperture alias with all current FF and MF sensors.
Dimy says
Are you talking about Alias-Effect. It is generated by the sensor alone through noise overlapping of lower frequencies. Lenses have coatings since the 70ties that filter out light so that the range is narrower that the sensitivity of the sensor(since then UV filters are obsolet). Side effect of course are better MTF graphs.
Example: The latest consumer camera has a pixel pitch of 4,14 µm. Over one mm that is 241,5 pixels. Let’s take 1/3 away due to the Bayer-pattern so that generously 200px/mm or 100lp/mm!!!
Relevant for lens resolution is a contrast of at least 50%. The best lens I have ever seen had 80lp/mm @ 50%. This lens cost (then) 80k weighed approx. 2,5kg and was designed for a 1“ sensor for wafer inspection.
Consumer lenses MTF graphs top out at 60lp/mm – but contrast usually is worse than 50%.
JimK says
My personal threshold for practically excellent contrast at the Nyquist frequency is about 5%. In theory, you need even finer sampling than that.
https://blog.kasson.com/the-last-word/whats-your-q/
Lens coatings do nothing to reduce aliasing, and in fact make it worse by increasing image contrast.
Here’s a visual look at aliasing at several f-stops.
https://blog.kasson.com/gfx-100/a-visual-look-at-gfx-100-diffraction-blur/
JimK says
https://en.wikipedia.org/wiki/Aliasing
JimK says
This is a system test, not a lens test in isolation. I don’t have an optical bench.
JimK says
If you are designing lenses to be tested on a test bench, then lp/mm is a useful metric. You have control over the lens, but not the sensor. If you are a photographer using a lens with a particular sensor, you care about how sharp your images will be. Using cycles per picture height allows cameras of different sensor size to be compared. I’m going to ignore the differences between cycles and line pairs here.
Dimy says
Ok, I get your point. Thanks for explaining this to me.
JimK says
It’s a pleasure. Continue to ask questions if anything seems confusing.