This is the tenth post in a series about the Leica Q2 Monochrom. You can see all the other posts in the series by looking in the Category List drop-down menu on the right side of the page.

When I looked at the engineering dynamic range (EDR) of the Q2 Monochrom, I stumbled onto the fact that full scale for ISO 100 is lower than that for the higher ISO settings. Bill Claff advanced the conjecture that the programmable gain amplifier (PGA) was reducing the gain by a factor of two as the camera went from ISO 200 to ISO 100, and that the photodiode/capacitor was saturating before the analog to digital converter (ADC). I haven’t done a full photon transfer curve (PTC) for the camera yet. That would shed some light on the issue, but may samples near clipping tend to be sparse. So I went for a more direct approach.
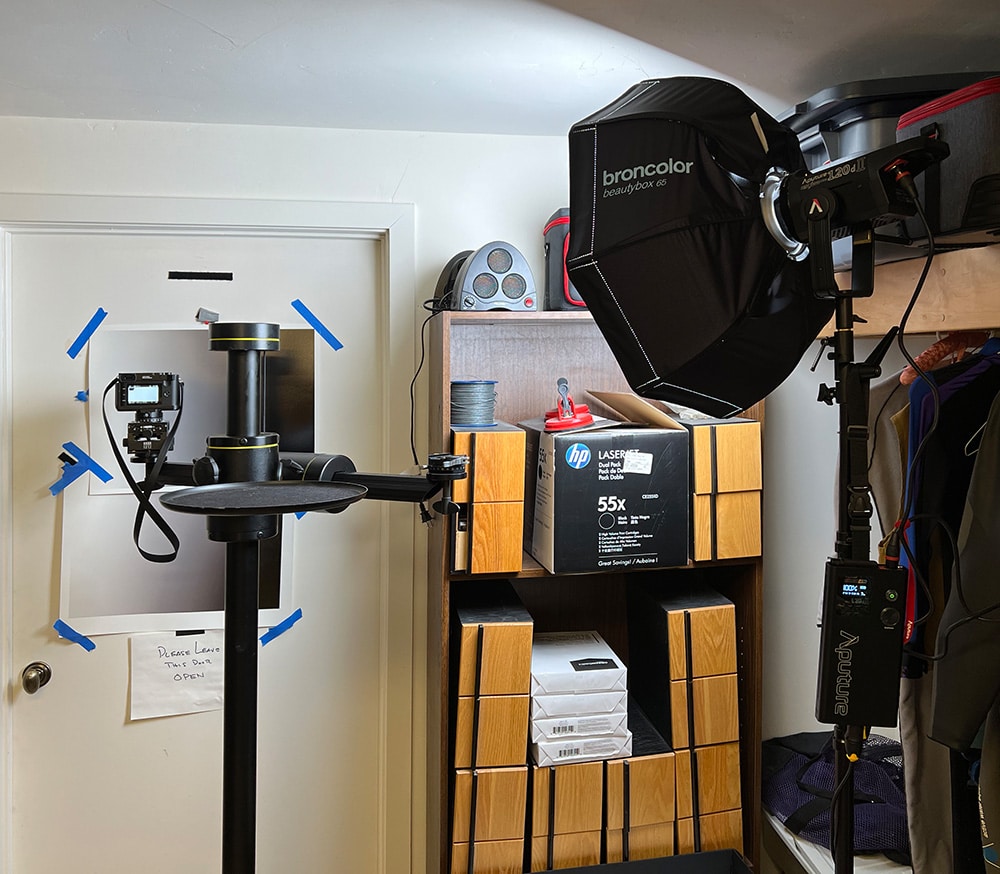
I set up the Q2 Monochrom on a camera stand (bet you’ve never seen a Q2 on a camera stand before), and aimed it at a linear gradient target.
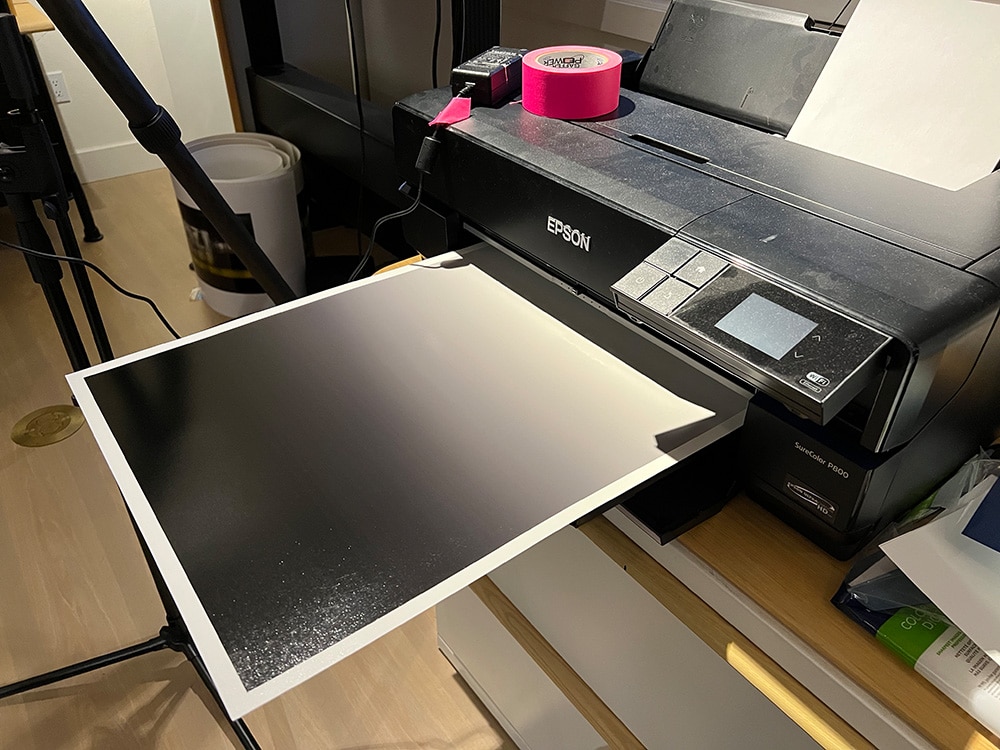
Here’s a look at the gradient:
I made a pair of exposures one stop apart at ISO 100 and ISO 200. I brought the raw files into RawDigger, selected an area short of clipping in the ISO 200 image which was short in the direction where the gradient image was constant, and long in the direction in which is was changing, and looked at the histogram of both selections.
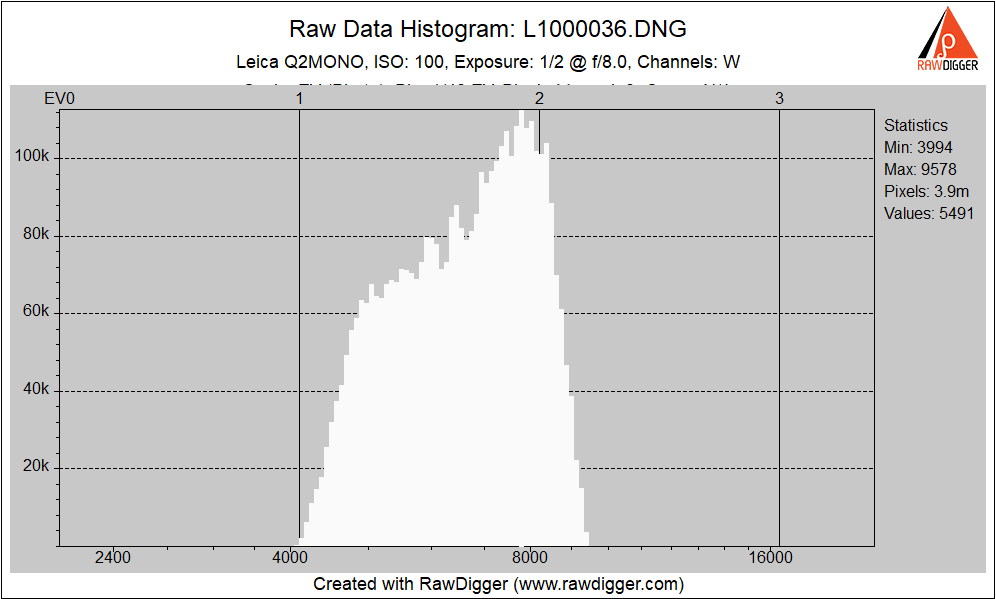
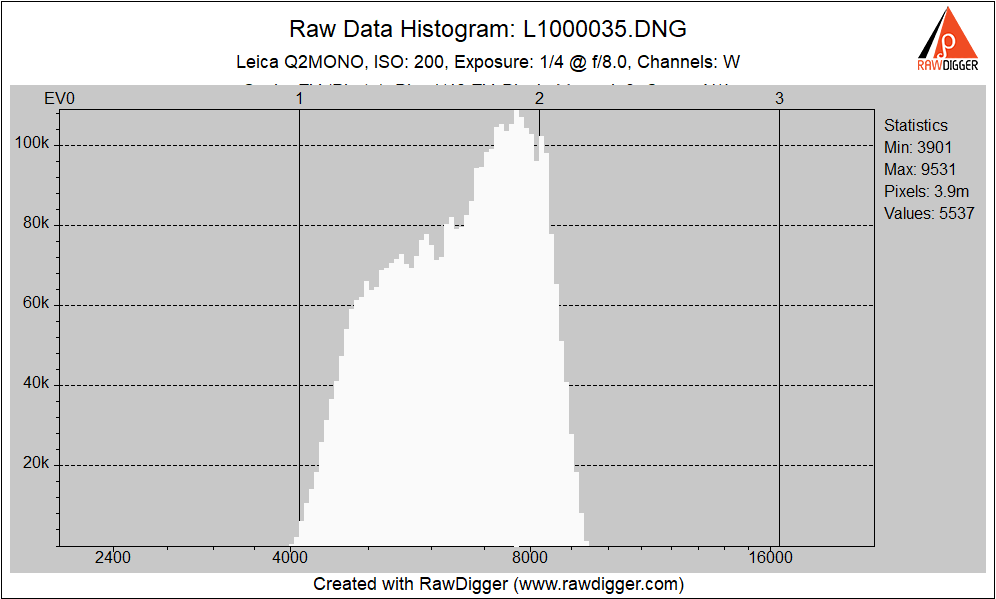
The histograms are virtually identical, indicating that ISO 100 does indeed have half the gain that ISO 200 does.
With the camera set up the same way, adjusting only the shutter speed, I made two more exposures, each a stop more generous than the first pair.
Here are those histograms:
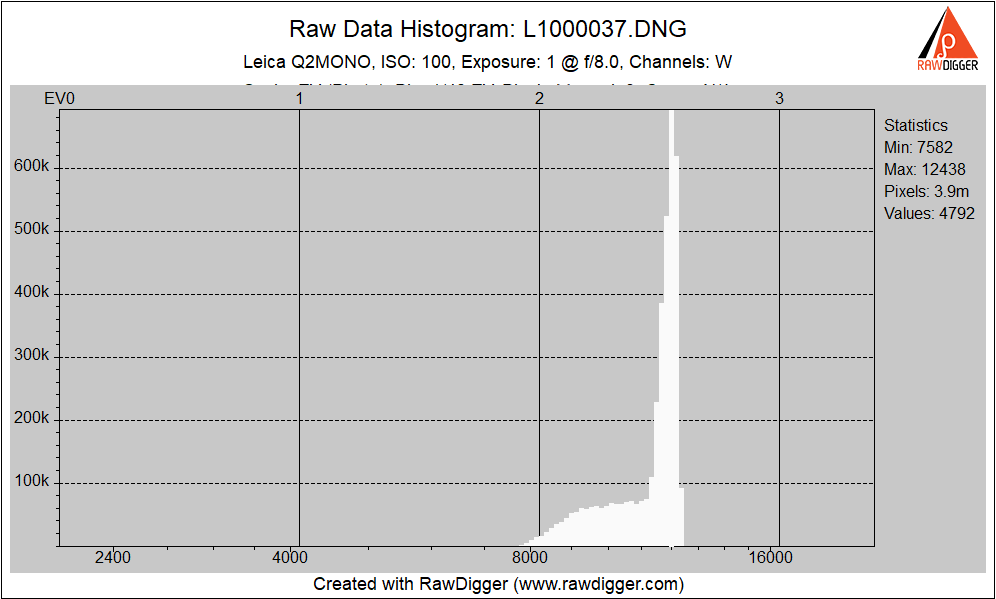
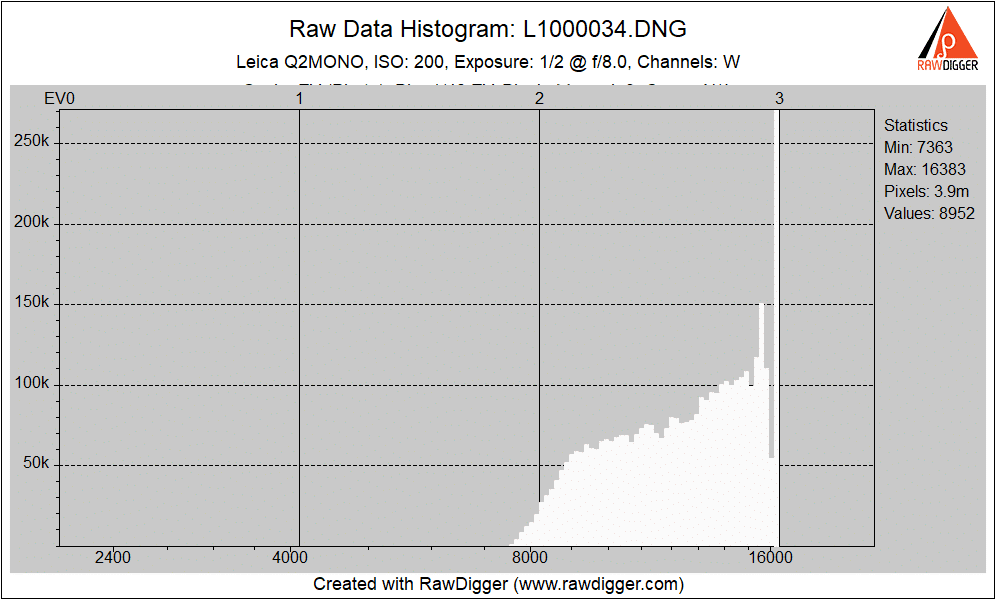
Looks like Bill’s conjecture was right. The left hand parts of the histogram are identical.
{The material below was added in response to a suggestion from a reader.]
To get greater precision than the above graphs allow, we can look at a brighter section of the above raw files, and expand the horizontal axis.
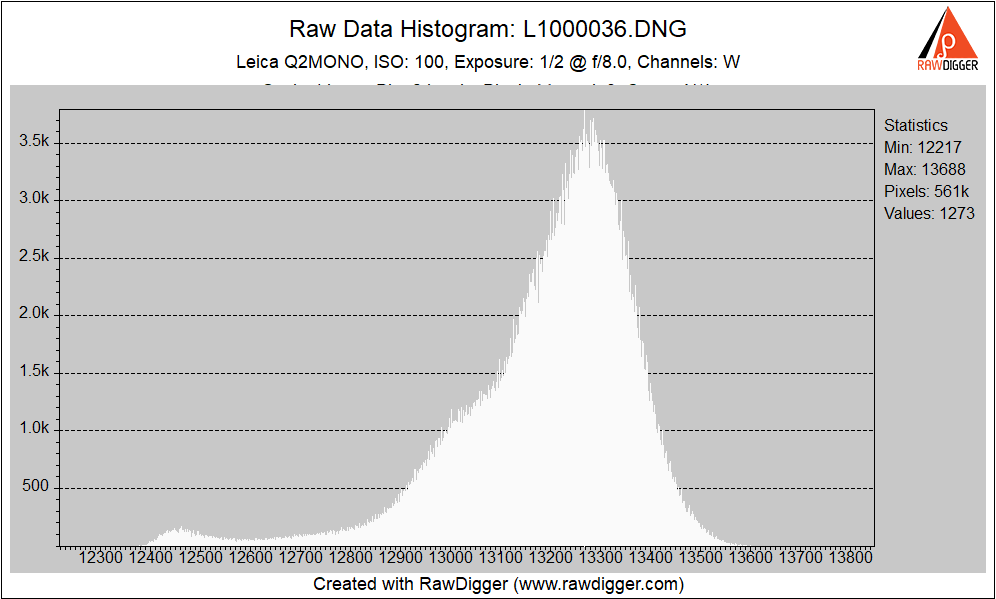
Looking closer with a brighter part of the image shows that the saturation count for ISO 100 is higher than it looked like in the first graphs.
By comparing this image with the one above it, you can see that the real ISO 100 shoulder starts at about 13100 and goes until over 13500.
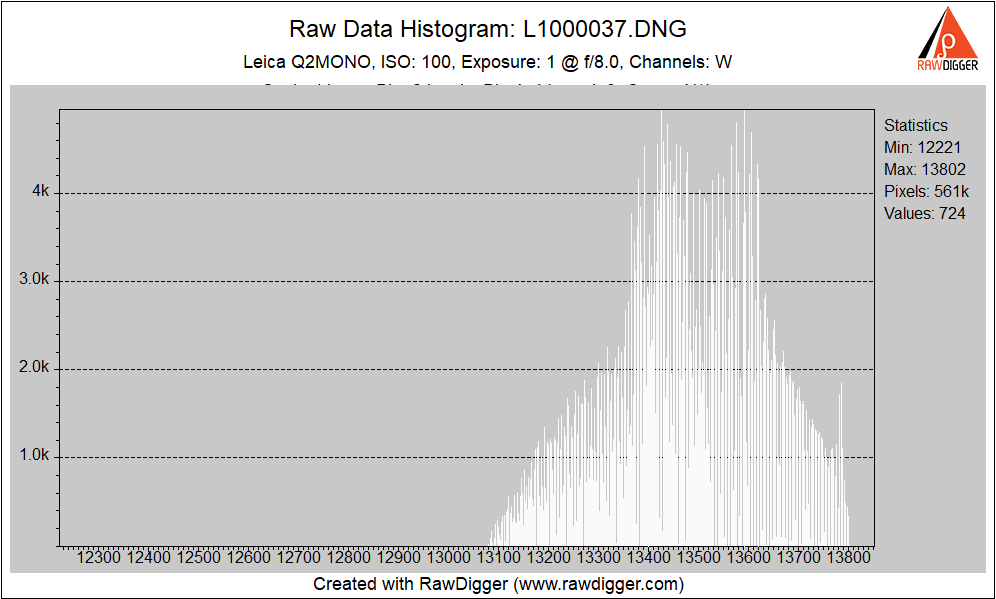
Doubling the exposure gets the ISO 100 saturation point up to 13800.
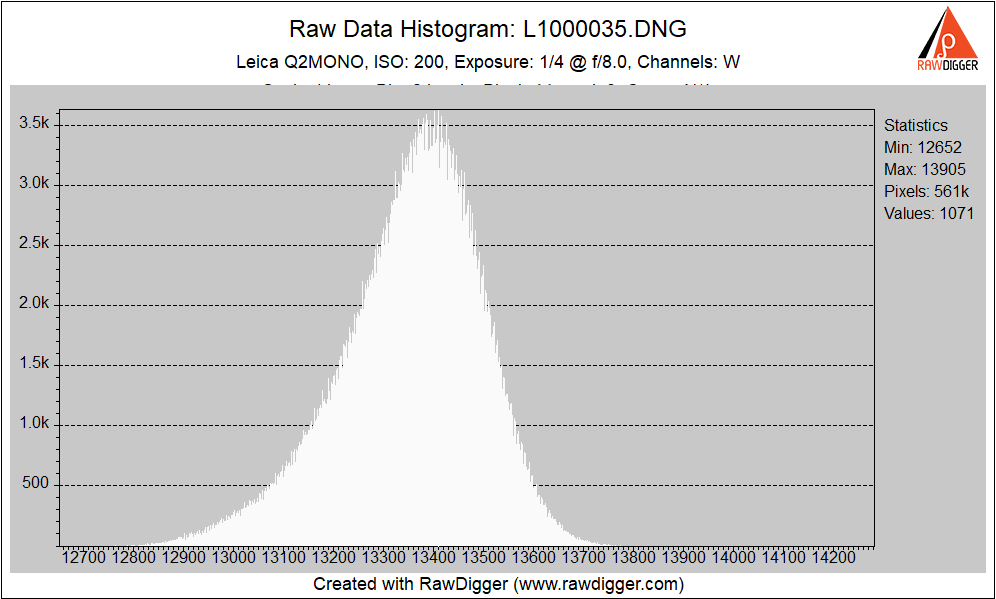
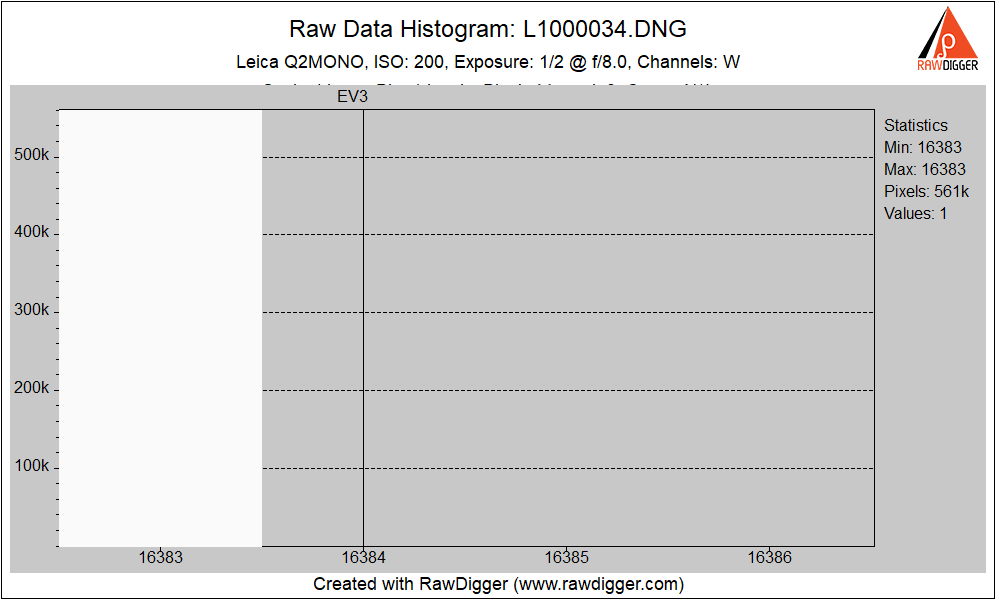
At half the exposure and at ISO 200, that part of the image is completely blown.
What does that tell us about EDR at the two ISO settings?
If we want our raw file to have a linear tone curve, we should consider full scale for ISO 100 to be about 13000. log2(16383/13000) is 0.33 stops. The EDR that I got earlier assuming full scale of 16383 at ISO 100 was 12.6 stops. If full scale is 13000, that is reduced to 12.3 stops. The EDR at ISO 200 is 12 stops. So you gain a third of a stop of EDR going from ISO 200 to ISO 100.
If it’s OK for our raw file to have a sharp shoulder, we should consider full scale for ISO 100 to be about 13500. log2(16383/13500) is 0.28 stops. The EDR that I got earlier assuming full scale of 16383 at ISO 100 was 12.6 stops. If full scale is 13500, that is reduced to 12.2 stops. The EDR at ISO 200 is 12 stops. So you do gain EDR going from ISO 200 to ISO 100. But there is some compression between 13000 and 13500, which means that the scene-referred dynamic range is bit higher than the numbers above indicate, and even higher than the scene-referred dynamic range of the ISO 200 image
My net on all this is that the ISO 100 setting on the Q2 Monochrom is useful in some circumstances, and is not a fake ISO in the sense that the lowest ISO settings in Nikon, Fujifilm, and Sony cameras are. However — and this is important if you do ETTR and plan to use ISO 100 — if you want a normal digital camera linear tone curve, clipping at ISO 100 will occur earlier than the live histogram in the finder indicates. If you’re OK with the shoulder, then you don’t have to apply windage to the live histogram at ISO 100.
It would be interesting to probe the highlight uniformity after analog clipping like this.