the last word

Photography meets digital computer technology. Photography wins -- most of the time.

  • site home
  • blog home
  • galleries
  • contact
  • underwater
  • the bleeding edge
You are here: Home / The Last Word / Benchmark color space conversion accuracy vs bit depth

Benchmark color space conversion accuracy vs bit depth

October 5, 2014 JimK Leave a Comment

I took the 256 megapixel, 16-bit per color plane image filled with uniformly-distributed random colors that I used for the previous post, and performed iterative color space conversions in Matlab from sRGB to Adode (1998) RGB and back, measuring the errors in CIELab Delta E after each round trip. Because the image was so large, I used either 2000×2000 or 4000×4000 pixel crops from the upper left corner. I did not recreate the image for each run; the colors started out the same.

If we convert the image from double-precision floating point to 16-bit unsigned integer representation after every color space conversion, we get worst-case errors that look like this:

s2a2s16wclab

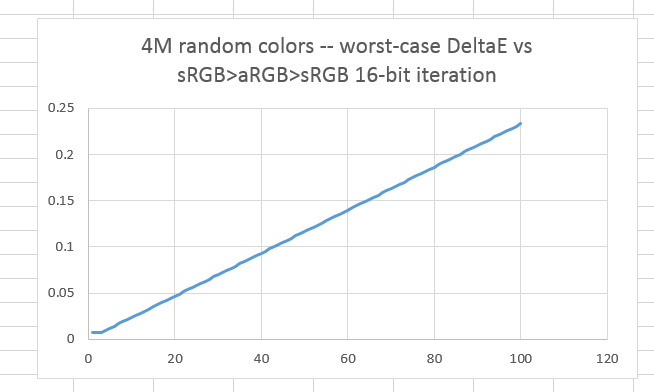
The standard deviation of the errors:

s2a2s16sigmalab

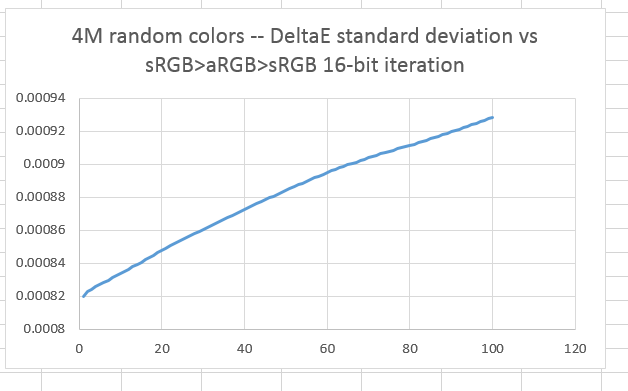
Here’s what the histogram of the Delta E error image looks like after 100 iterations:

hist16s2a2s100xzrand

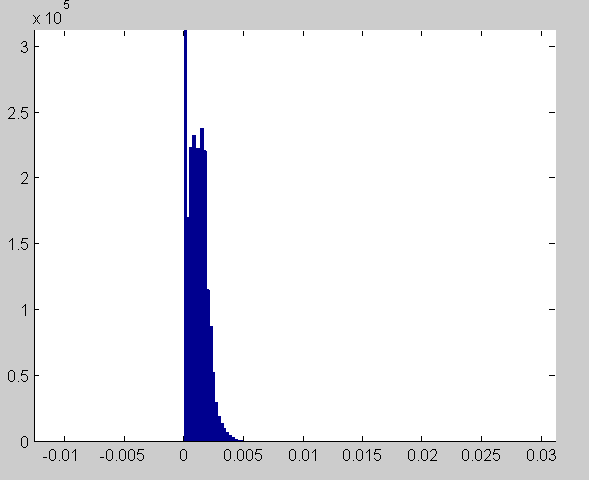
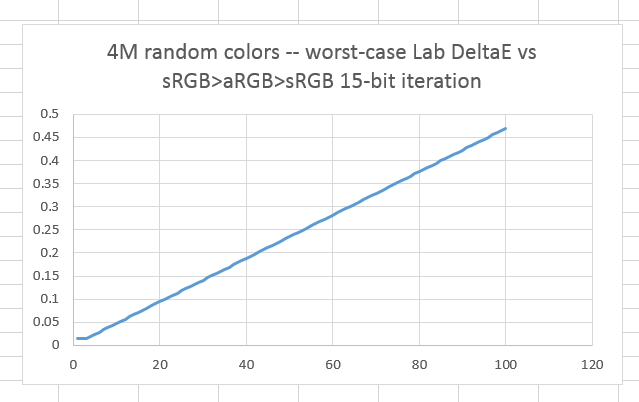
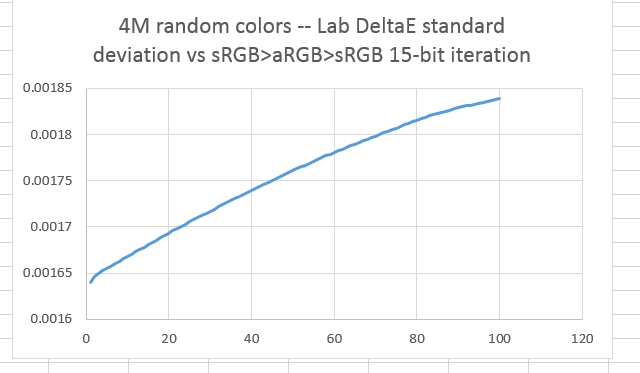
Some say that Photoshop only has 15 bits of precision in its working color space. If we redo the tests with the post-conversion quantizing set to 15 bits, we get worst case numbers like this:

s2a2s15wclab

And standard deviations like this:

s2a2s15sigmalab

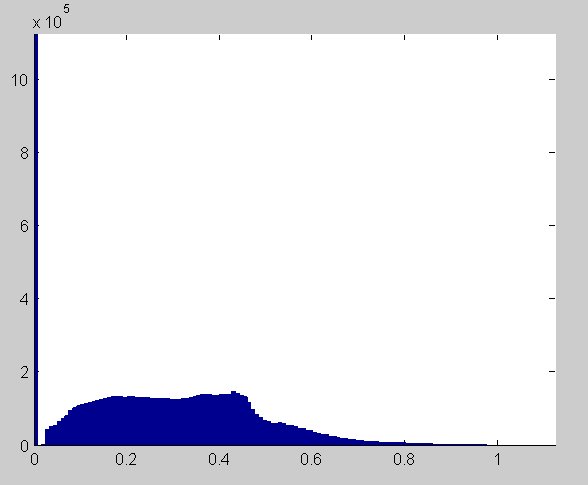
The DeltaE histogram after 100 iterations is as follows (note that the top is chopped off for clarity):

hist15s2a2s100xzrand


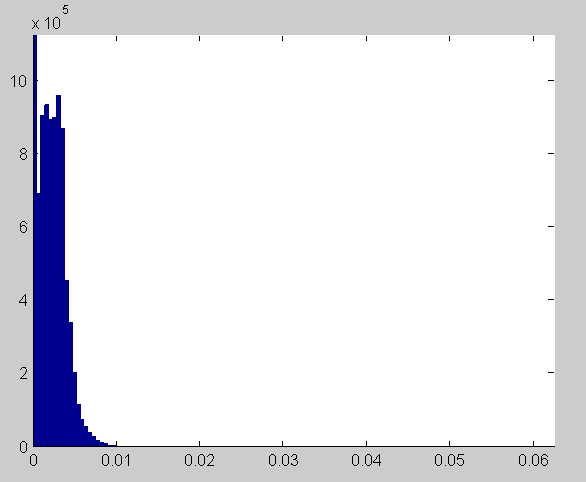
With 15 bit precision, everything looks twice as bad as it does with 15-bit quantizing, but not bad at all in absolute terms.

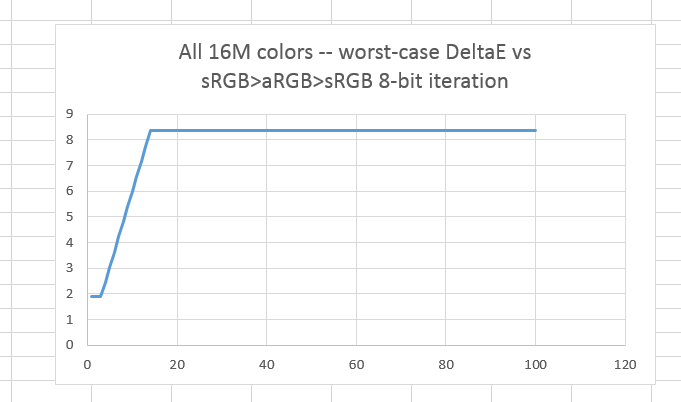
When we look at quantizing to 8 bits, we no longer need a random color image; we can use an image with all 16 million colors representable with 8-bit precision. Repeated round trip conversions at 8-bit precision results in these worst-case errors:

s2a2s8wclab

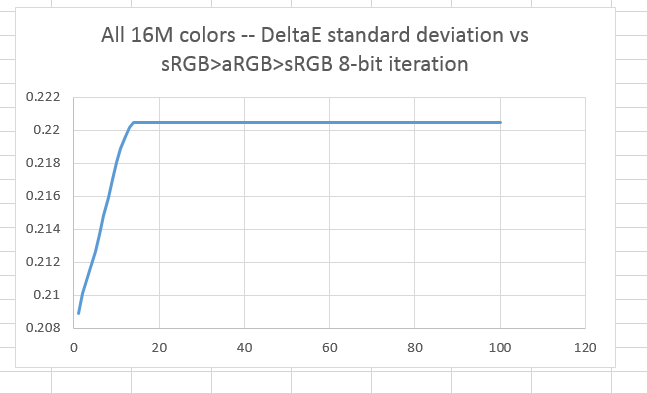
And this is what the standard deviation looks like:

s2a2s8sigmalab

The worst-case errors are considerable with 8-bit precision, but after less than 20 iterations, they stop getting worse. This is cold comfort, because in reality you’d be editing the image with each iteration, creating new colors to be lightly mangled by the conversion.

After 100 iterations, the histogram looks oddly lumpy:

hist8s2a2s100xz


The Last Word

← Photoshop color space conversion errors measured in CIEluv 8 bit color space conversion error locations →

Leave a Reply Cancel reply

Your email address will not be published. Required fields are marked *

January 2023
S M T W T F S
1234567
891011121314
15161718192021
22232425262728
293031  
« Dec    

Articles

  • About
    • Patents and papers about color
    • Who am I?
  • Good 35-70 MF lens
  • How to…
    • Backing up photographic images
    • How to change email providers
  • Lens screening testing
    • Equipment and Software
    • Examples
      • Bad and OK 200-600 at 600
      • Excellent 180-400 zoom
      • Fair 14-30mm zoom
      • Good 100-200 mm MF zoom
      • Good 100-400 zoom
      • Good 100mm lens on P1 P45+
      • Good 120mm MF lens
      • Good 18mm FF lens
      • Good 24-105 mm FF lens
      • Good 24-70 FF zoom
      • Good 35 mm FF lens
      • Good 60 mm lens on IQ3-100
      • Good 63 mm MF lens
      • Good 65 mm FF lens
      • Good 85 mm FF lens
      • Good and bad 25mm FF lenses
      • Good zoom at 24 mm
      • Marginal 18mm lens
      • Marginal 35mm FF lens
      • Mildly problematic 55 mm FF lens
      • OK 16-35mm zoom
      • OK 60mm lens on P1 P45+
      • OK Sony 600mm f/4
      • Pretty good 16-35 FF zoom
      • Pretty good 90mm FF lens
      • Problematic 400 mm FF lens
      • Tilted 20 mm f/1.8 FF lens
      • Tilted 30 mm MF lens
      • Tilted 50 mm FF lens
      • Two 15mm FF lenses
    • Found a problem – now what?
    • Goals for this test
    • Minimum target distances
      • MFT
      • APS-C
      • Full frame
      • Small medium format
    • Printable Siemens Star targets
    • Target size on sensor
      • MFT
      • APS-C
      • Full frame
      • Small medium format
    • Test instructions — postproduction
    • Test instructions — reading the images
    • Test instructions – capture
    • Theory of the test
    • What’s wrong with conventional lens screening?
  • Previsualization heresy
  • Privacy Policy
  • Recommended photographic web sites
  • Using in-camera histograms for ETTR
    • Acknowledgments
    • Why ETTR?
    • Normal in-camera histograms
    • Image processing for in-camera histograms
    • Making the in-camera histogram closely represent the raw histogram
    • Shortcuts to UniWB
    • Preparing for monitor-based UniWB
    • A one-step UniWB procedure
    • The math behind the one-step method
    • Iteration using Newton’s Method

Category List

Recent Comments

  • JimK on Picking a macro lens
  • Glenn Whorrall on Picking a macro lens
  • JimK on What pitch do you need to scan 6×6 TMax 100?
  • Hatzipavlis Peter on What pitch do you need to scan 6×6 TMax 100?
  • JeyB on Internal focusing 100ish macro lenses
  • JimK on How focus-bracketing systems work
  • Garry George on How focus-bracketing systems work
  • Rhonald on Format size and image quality
  • JimK on Internal focusing 100ish macro lenses
  • Darrel Crilley on Fuji 100-200/5.6 on GFX, Nikon 70-200/@2.8E, Apo-Sonnar 135 on Z7, revisited

Archives

Copyright © 2023 · Daily Dish Pro On Genesis Framework · WordPress · Log in

Unless otherwise noted, all images copyright Jim Kasson.