After constructing the software tools to get the results for the last few posts, it occurred to me that I’d done most of the work to take a crack at something that had always interested me, but I’d never gotten around to researching: do camera color filter arrays (CFAs) that produce more accurate results when trained with the Macbeth CC24 patch set produce more accurate results for spectra outside of that set?
When searching for optima, it’s always dangerous to measure the success of your optimization by using the same set of challenges that you trained the program with. Yet it is common for people to build color profiles using the 24-patch Macbeth Color Checker set, and describe how good the profiles are by testing them with that very set. I myself have been guilty of this time and time again. It would be nice if there were many spectral sets like the CC24 patch set, and we could freely use them in a standard way, but, sadly, that is not the case. There is a larger Macbeth/XRite patch set, but as far as I know the spectra aren’t available. I could go running around the house with a spectrophotometer and create a personal patch set — and I may do so — but that wouldn’t be reproducible unless I published the spectra and people could use those for simulations and/or create objects with those reflectance spectra.
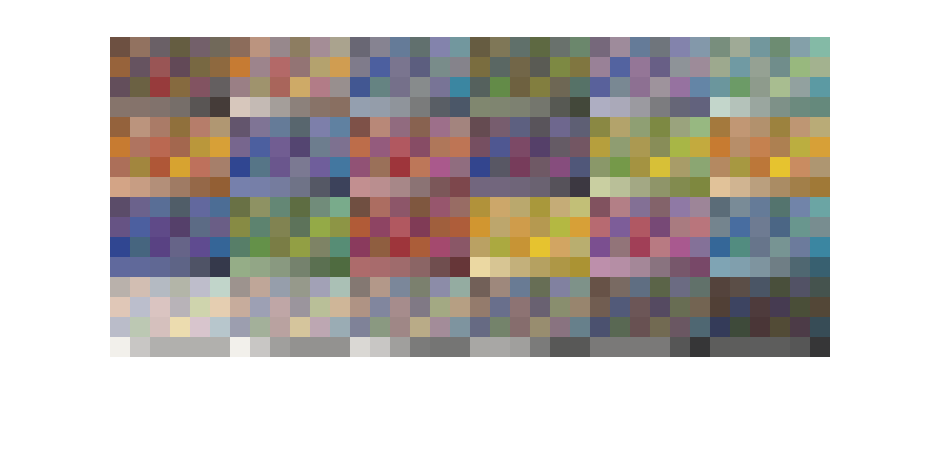
So I expanded my idea of pairwise mixing of the CC24 spectra. I created this set:
There are 24 4×6 patch sets arranged in a larger 4×6 pattern. In each of the smaller 4×6 grids, a base color reflectance spectrum is mixed in turn with each of the other base colors in an amount that provides a shift in color of 15 CIELab Delta E 2000 units. The organization of the grids and sub grids is the same as that of the Macbeth CC24 chart. So, starting out with 24 spectra, we have produced 576 spectra (which include the 24 original spectra), spanning a broad range of the gamut of the CC24 patch set.
Using my color camera simulator I lit the above 576-strong patch set with D50 light, and calculated the response of several simulated camera systems, in each case using an optimized compromise matrix for converting camera raw values to colors.
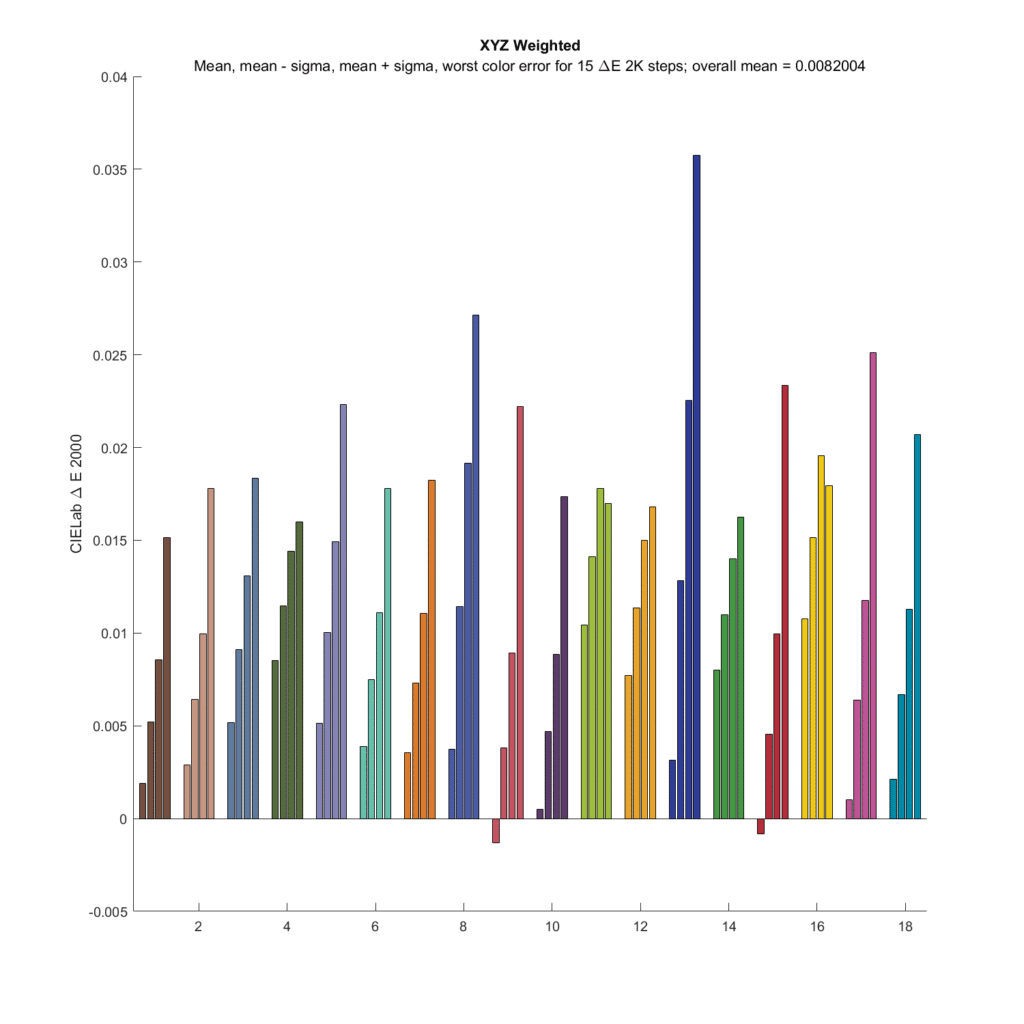
Here are the results for a camera whose camera/CFA filter spectral responses are the CIE 1931 XYZ color weighting functions:
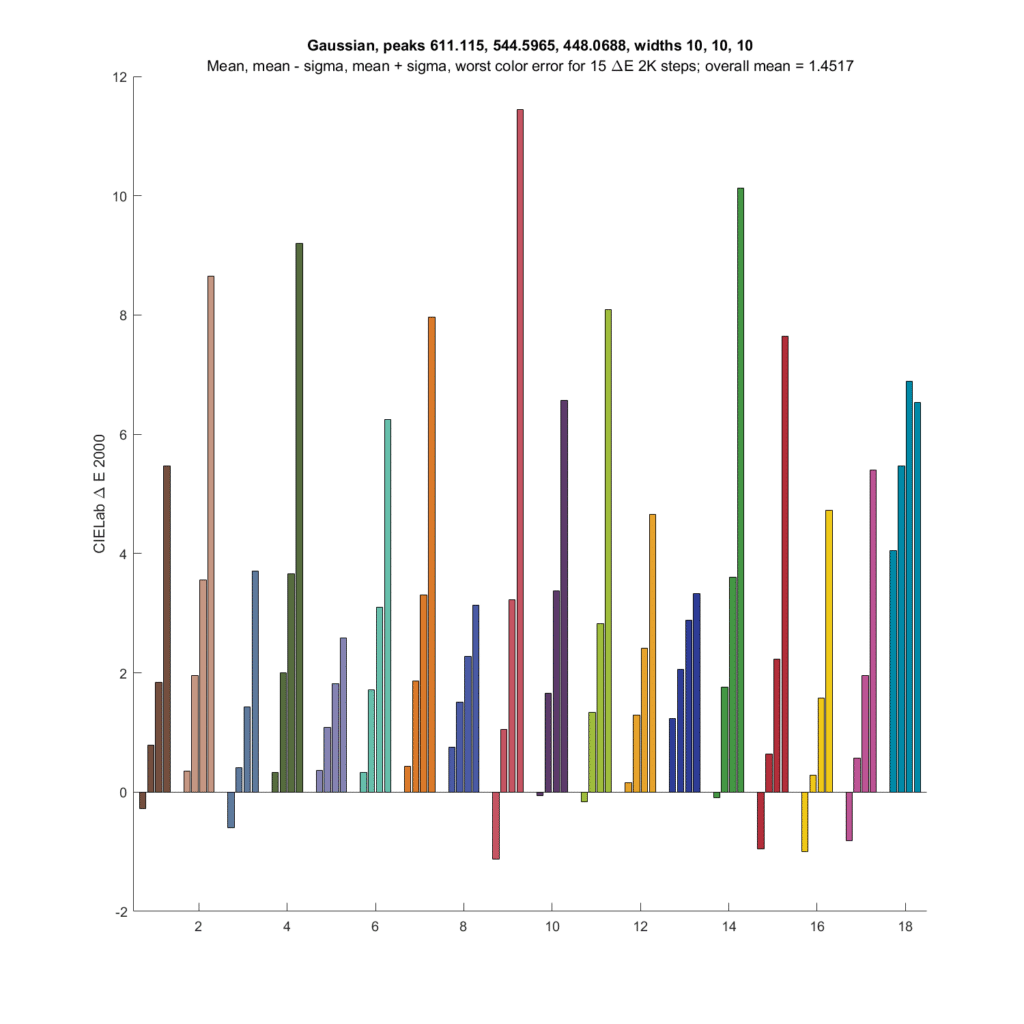
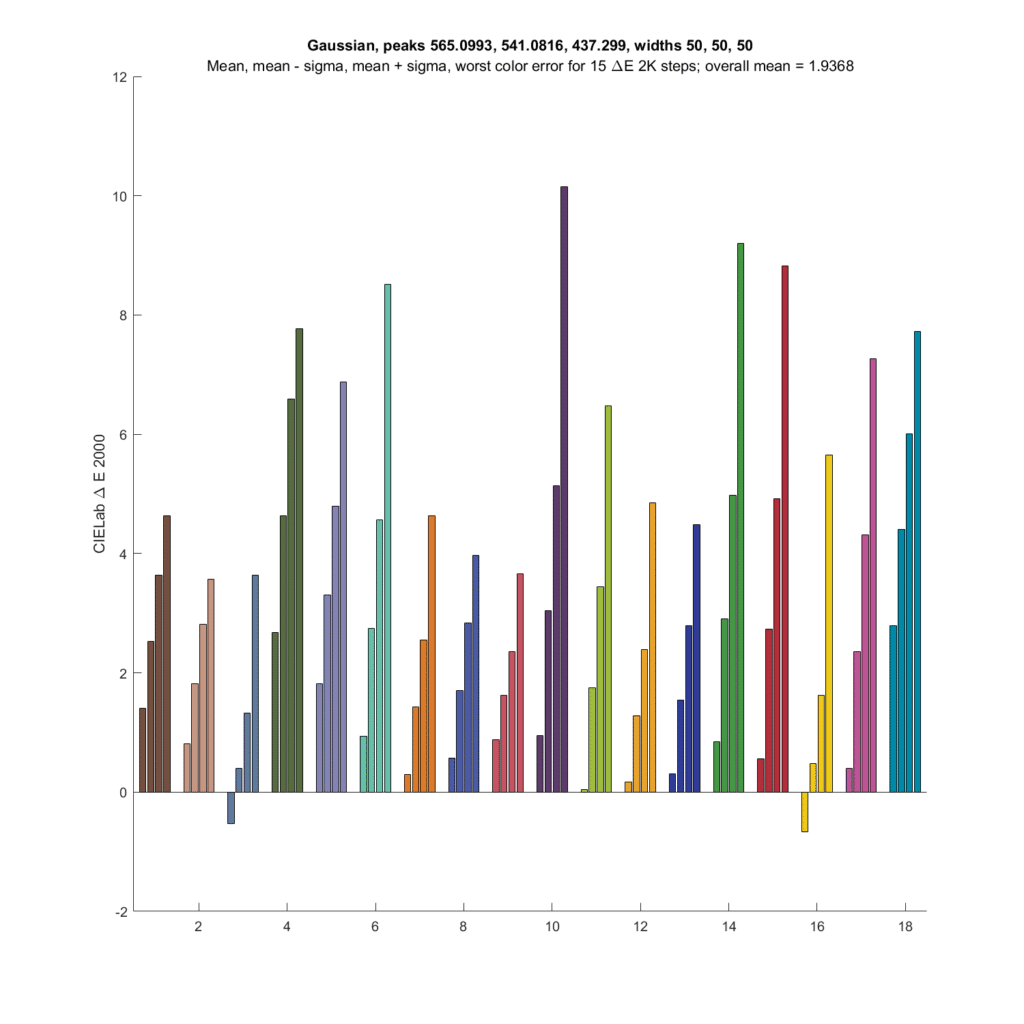
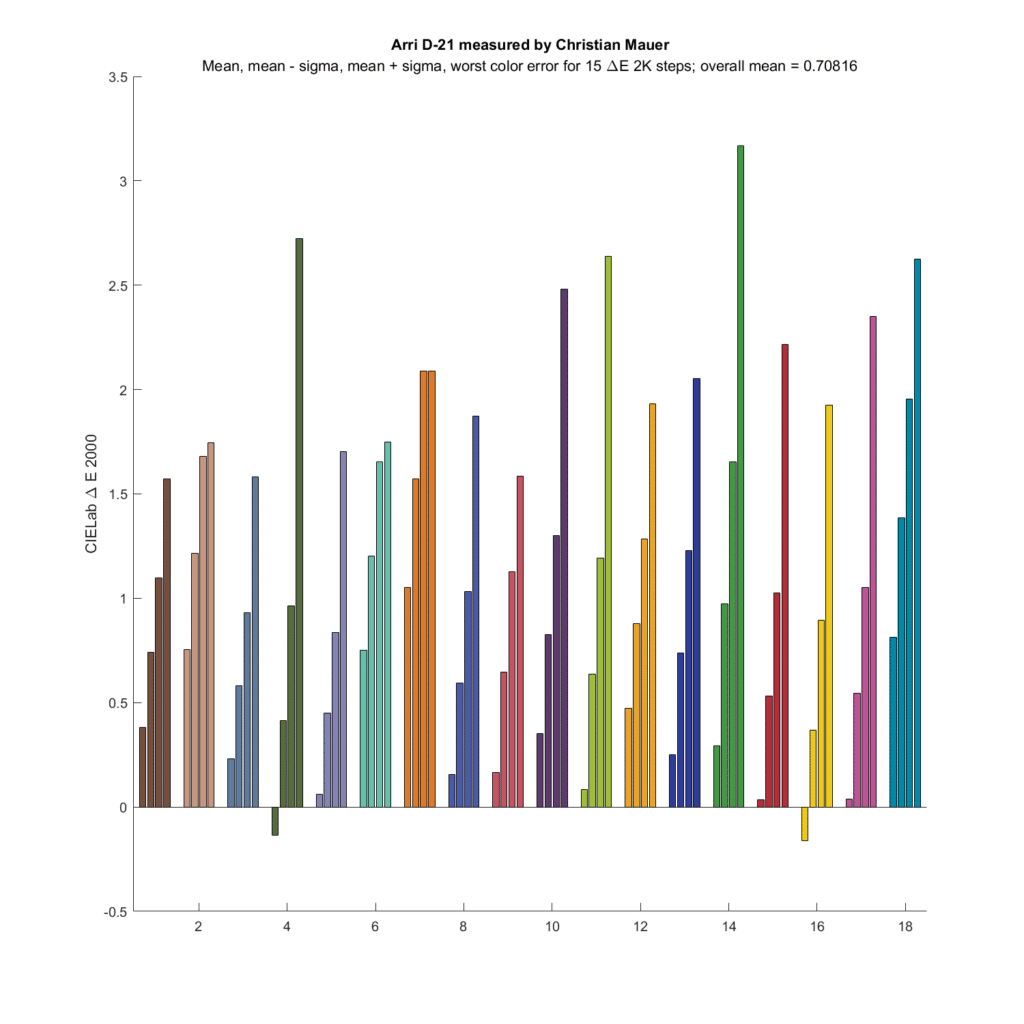
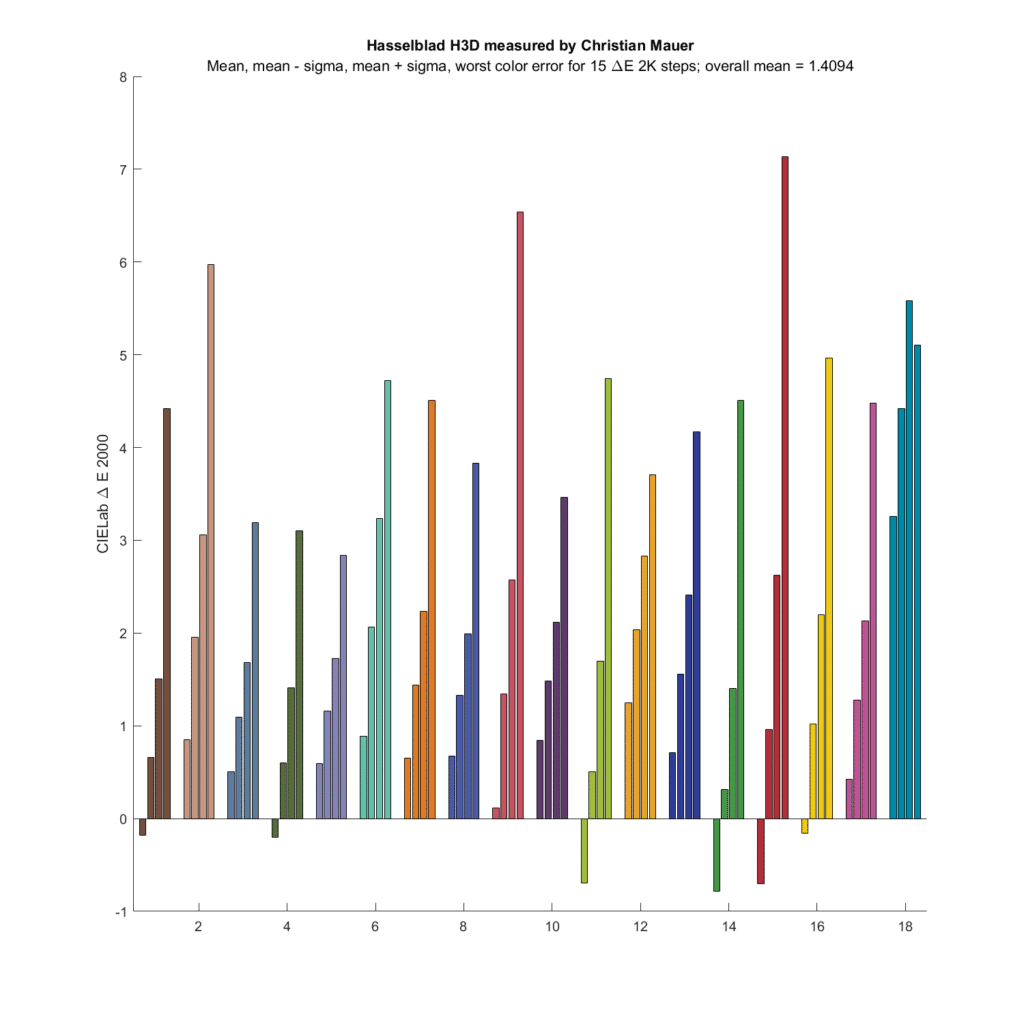
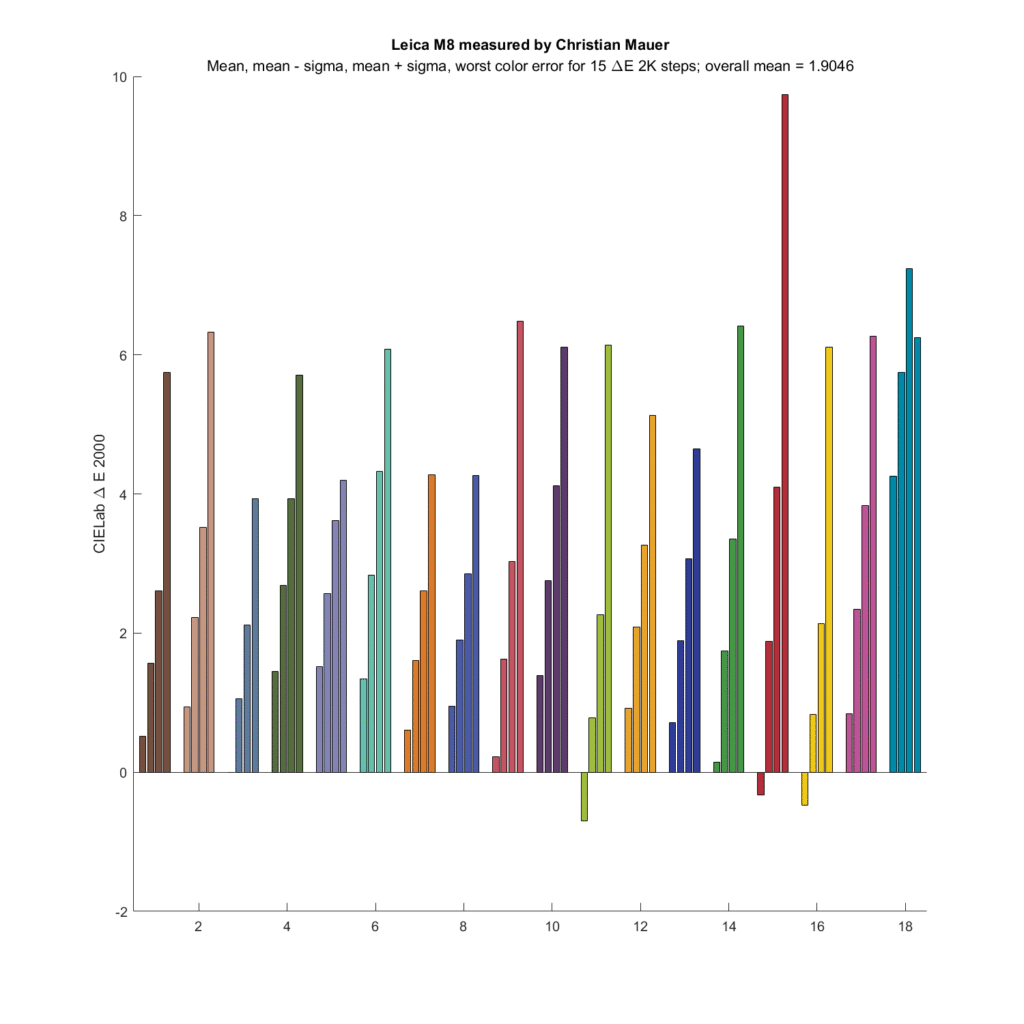
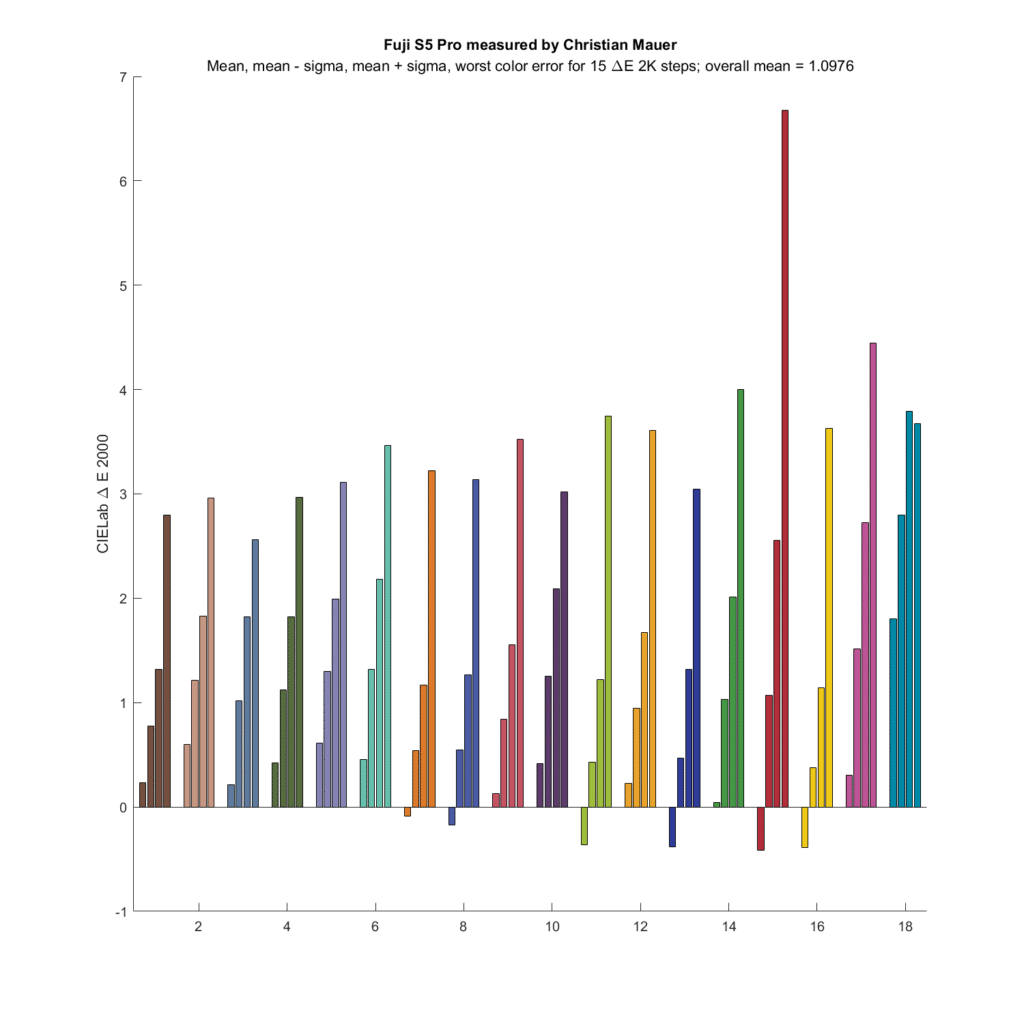
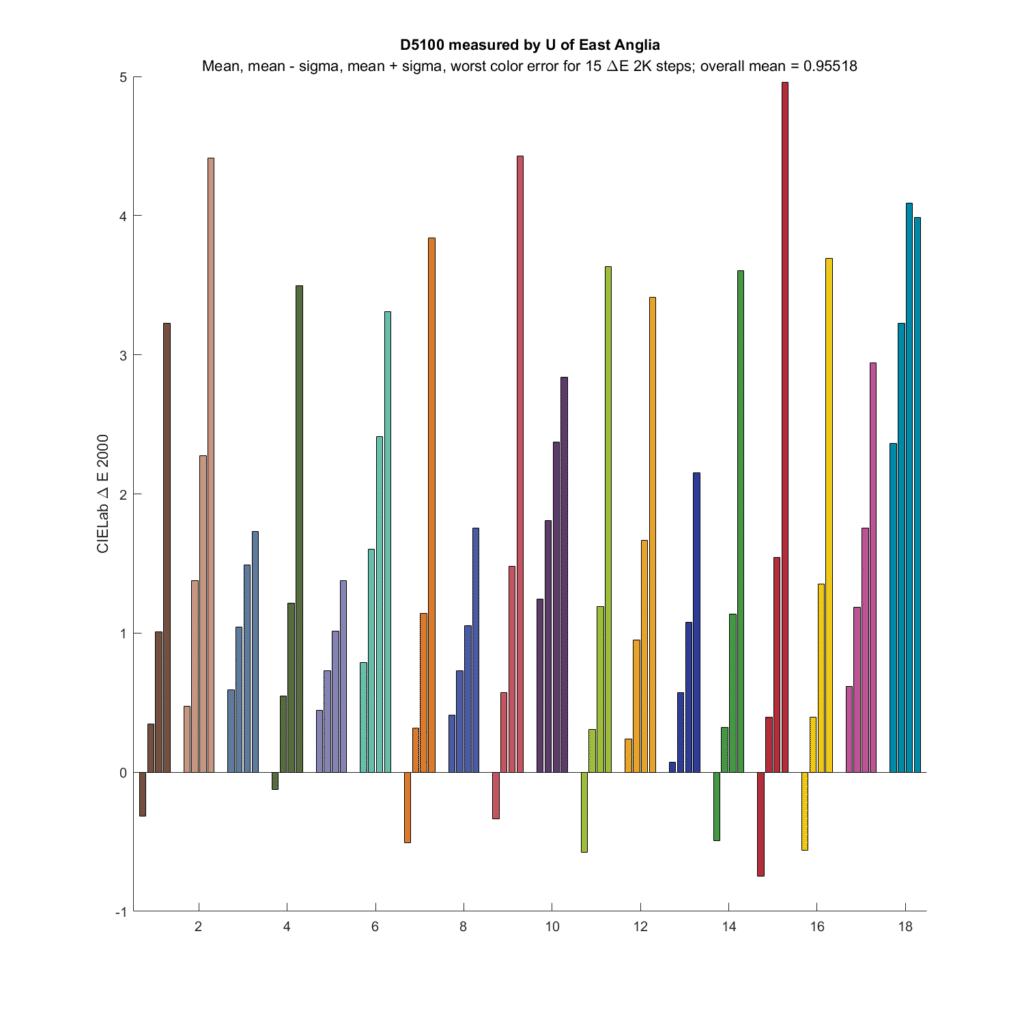
Each set of four identically-colors bars represents data obtained when one of the top three rows of the CC24 (leaving out the gray-axis row) is used as a base color and mixed in turn with all the other CC24 patches. So each set of same-color bars represents the statistics from 24 patches. The colors of the bars are the colors of the base color patches. The vertical accuracy is the error between the colors captured by the camera/raw developer and the colors as seen by the CIE 1931 Standard Observer. In the set of four bars, the leftmost bar is the mean minus the standard deviation (aka sigma), the next bar is the mean, the next bar is the mean plus standard deviation, and the rightmost bar is the worst error.
The above is mostly a test of the programming, since the camera’s CFA is the same as the standard observer. The program that optimized the compromise matrix construction did not perfectly find the right matrix, which is the identity matrix, and thus the SMI is not 100; it is 99.7. Still, the overall worst case error is about a third of a DeltaE, which isn’t much to worry about.
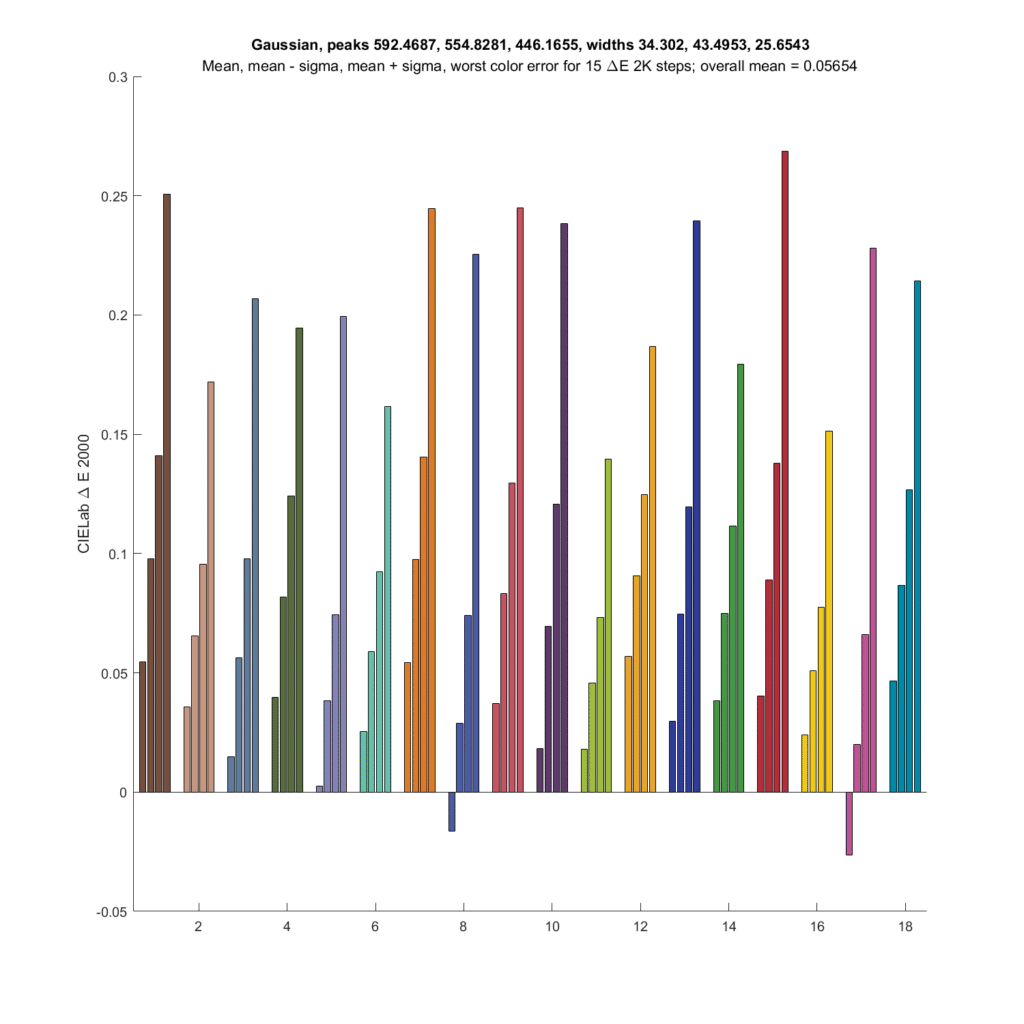
Next up is the optimized Gaussian CFA set, which has an SMI of 99.3:
The errors are about a decimal order of magnitude higher. The relative spread among the four statistical metrics seems to be about the same.
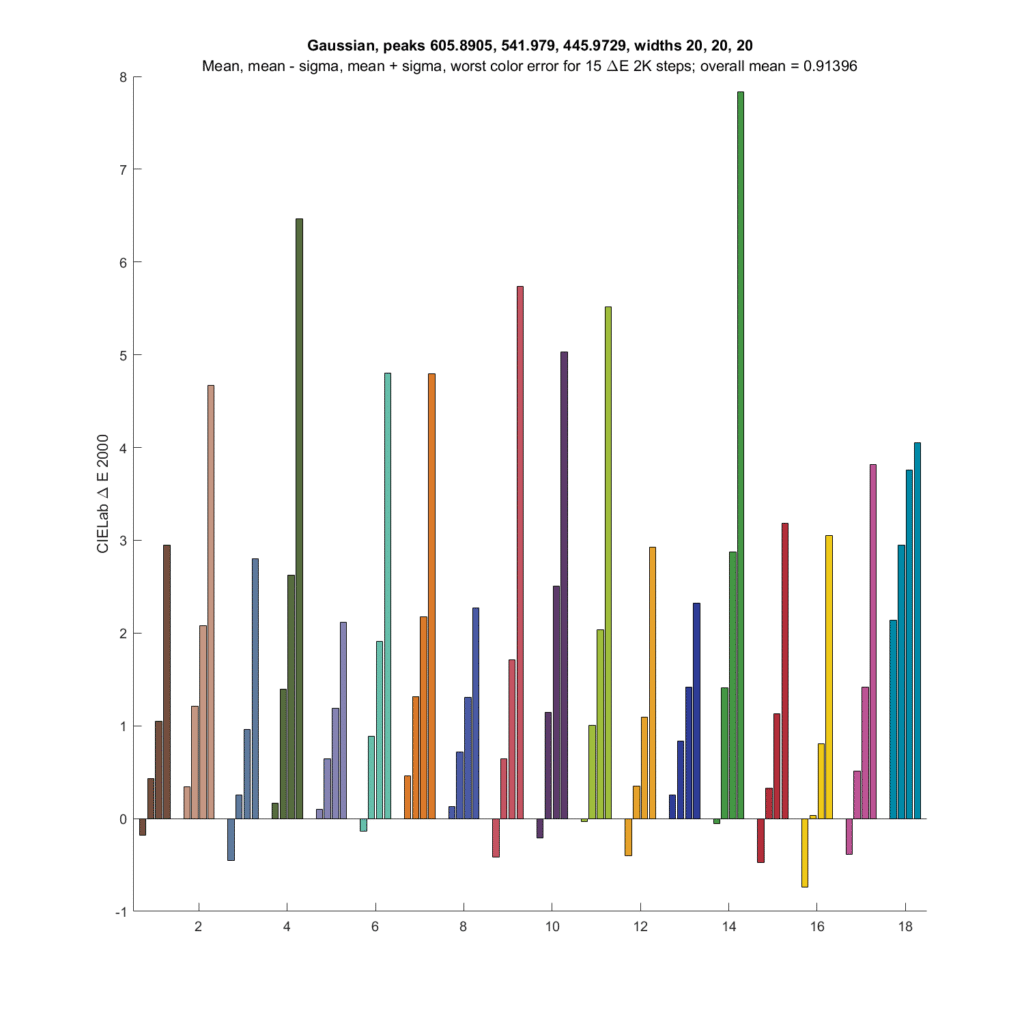
Now a set of Gaussian spectra, with the standard deviation set to 20 nm — quite a bit narrower than the optimum:
This makes the errors much worse.
Tightening the standard deviation still further, to 10 nm, and reoptimizing the peak wavelengths:
Things get even worse.
A standard deviation of 50 nm, with optimized peak wavelengths:
Still pretty bad.
Now let’s look at some cameras. First up is the Arriflex D-21, which has an SMI in the high 80s, which is quite good for a commercial camera:
That is pretty good. The mean overall deltaE is less than one.
How about couple of CCD cameras:
Not very good. Their SMIs aren’t very good, either.
A few more:
The Nikon D5100 isn’t bad at all.
My conclusions:
- If a camera is accurate with a CC24 patch set as the test stimuli, it will probably be relatively accurate throughout the gamut of that patch set.
- There will be errors that are quite a bit worse than the 24-patch errors. Training the optimizer on 24 patches is not enough to produce consistant accuracy throughout the 576 patch set.
- The relative spread of the errors doesn’t change a lot as the CFA filters change. If it’s a bad set for the CC24 patches, it will have roughly the same variation as a percent of the errors for the smaller set.
As always, there are a few caveats:
- Because of the way I constructed the 576-patch spectra, they are not independent. Indeed, it is questionable whether the CC24 set have independent spectra.
- Because of the way I constructed the 576-patch spectra, their colors can’t get outside the CC24 gamut. I have a way to fix this, and I may try it.
Since a matrix is a linear operation upon the color vector, then wouldn’t the delta-E for a mixture of two spectra that it was optimized for also be fairly optimized?
I do think you should use some other unrelated spectra as a control.
Turns out that there’s a lot of variation, but you have a point. I mentioned that in the post. Working on some more reflectance spectra.
Spot on and great idea to start looking at a larger set of spectra. The reflectance spectra of the CC24 has a dimensionality of about 3 according to PCA analysis and looking for a 99% explanation of the variance. It actually makes the CC quite a bad target for designing optimal color correction matrices (RAW -> XYZ matrix)
There are other much larger datasets available. Look at ISO InSitu or Image Engineering InSitu datasets. unfortunately these are not free but they include thousands of measurements. Alternatively you could look at the dataset for the IES-TM30 Color Rendition standard. In includes 99 reflectance curves that were chosen from more than 100,000 to increase color and spectral sampling of exactly these types of analysis (high dimensionality).
I am now using some of these reflectance spectra:
https://chromaxion.com/spectral-library.php