the last word

Photography meets digital computer technology. Photography wins -- most of the time.

  • site home
  • blog home
  • galleries
  • contact
  • underwater
  • the bleeding edge
You are here: Home / The Last Word / Photoshop Gaussian noise spectrum

Photoshop Gaussian noise spectrum

September 21, 2014 JimK Leave a Comment

In the two previous posts, I identified some anomalies with Matlab’s implementation of bilinear interpolation downsampling at reduction ratios that are integral powers of two. I also observed smaller, but similar, anomalies with bicubic, Lanczos 2, and Lanczos 3 downsampling.

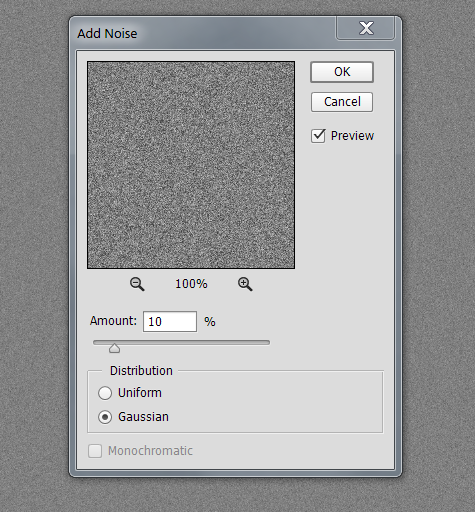
Today I set out to find out if the Photoshop implementations of bilinear interpolation evinced the same effects. I created a new 4000×4000 16-bit gray gamma 2.2 image, filled it with 50% gray, and used the “Add Noise” filter to add 10 % Gaussian noise.

addnoisePs

I downsized the image several different ways, and, as a check, looked at their spectra in Matlab. The spectra were jagged in one direction. I looked at the spectrum of the image that I’d created in Photoshop before downsizing:

Pstargetnoiseimagespectrum

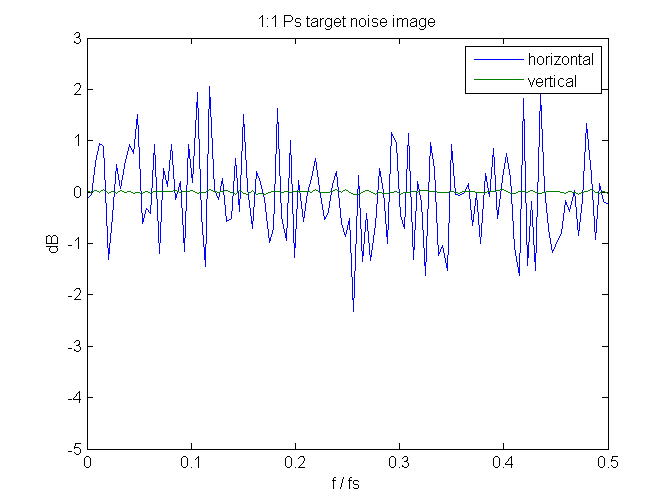
The above is the spectrum of the image after conversion to linear representation.

That’s strange. The vertical spectrum looks fine, but the horizontal spectrum is jagged.

I created a similar image in Matlab, being sure to set the gamma to 2.2, and computed its spectrum in linear space:
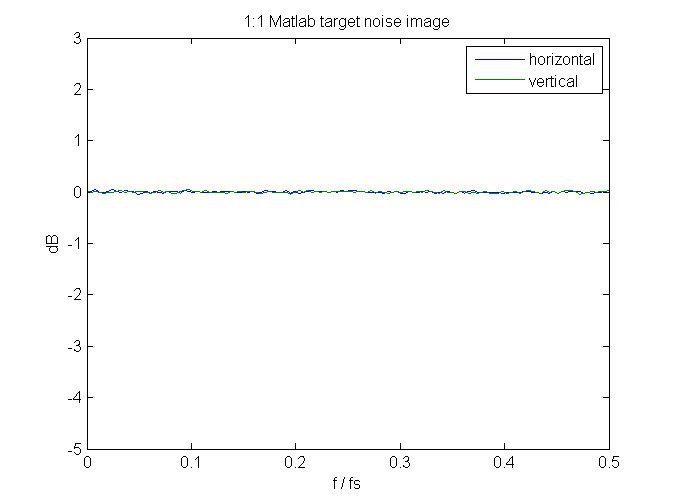
Matlabtargetnoiseimagespectrum

All is well.

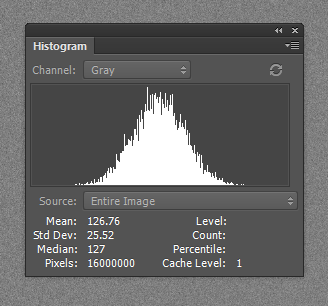
I looked at the histogram of the Ps-generated image in Ps:

psnoisehisto

and in Matlab at gamma = 2.2:

psnoisehistogamma22

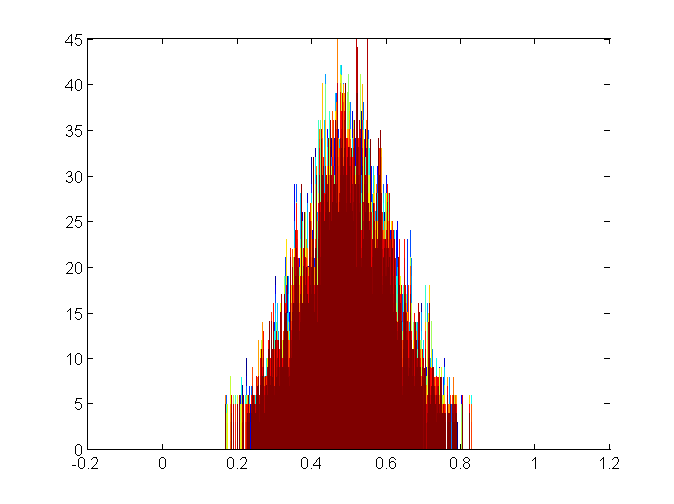
The Ps-generated shape seems wrong as measured in Matlab. The skirts don’t extend far enough, although the Ps histogram looks OK.

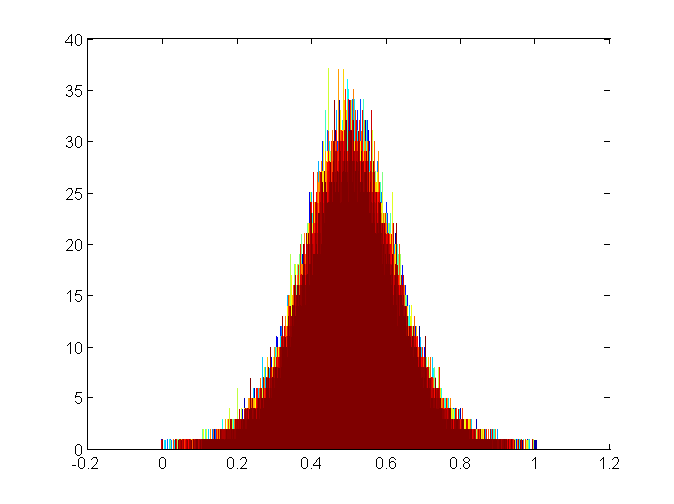
Here’s the histogram of the Matlab-generated image in Matlab at gamma = 2.2:

. matlabnoisehistogamma22

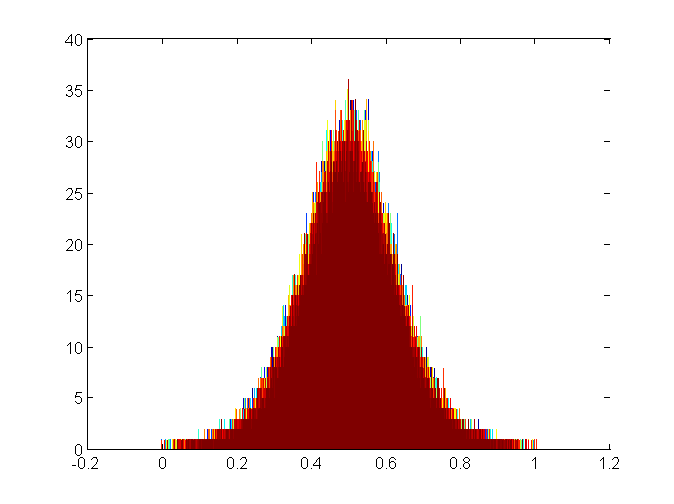
Then I generated the image in Matlab and wrote it to a file with this code:

NoiseImagecode

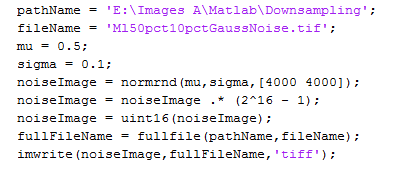
Here’s what the histogram looks like in Ps:

MLnoiseImagehistoPs

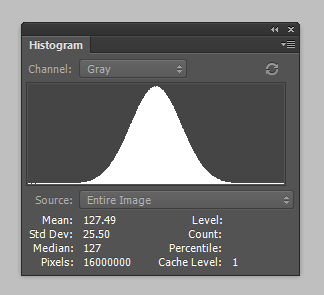
Compare that to the ragged histogram of the image generated in Ps:

psnoisehisto

Note that the mean in the Matlab-genetated image is 127.49. Perfection would be 127.5. The mean in the Photoshop-generated image, 126.76, is too low. The standard deviations in both images look OK as measured in Ps.

The problem is not in the way that Ps writes TIFFs or the way that Matlab reads them. Here’s a Matlab histogram of a Matlab-generated noise image after a round trip through Photoshop:

matlabnoisehistoRT

It looks fine.

I won’t be able to use Photoshop to generate the target images for my downsampling testing, or any other testing involving noise. I don’t trust it any more.

I don’t think these departures from Gaussian perfection should disqualify th Ps Add Noise… filter for normal photographic use, but I think they take it out of the running for measurements.


The Last Word

← Noise reduction and downsampling with a gamma of 2.2 Noise effects of Photoshop bilinear interpolation downsizing →

Leave a Reply Cancel reply

Your email address will not be published. Required fields are marked *

February 2023
S M T W T F S
 1234
567891011
12131415161718
19202122232425
262728  
« Jan    

Articles

  • About
    • Patents and papers about color
    • Who am I?
  • Good 35-70 MF lens
  • How to…
    • Backing up photographic images
    • How to change email providers
  • Lens screening testing
    • Equipment and Software
    • Examples
      • Bad and OK 200-600 at 600
      • Excellent 180-400 zoom
      • Fair 14-30mm zoom
      • Good 100-200 mm MF zoom
      • Good 100-400 zoom
      • Good 100mm lens on P1 P45+
      • Good 120mm MF lens
      • Good 18mm FF lens
      • Good 24-105 mm FF lens
      • Good 24-70 FF zoom
      • Good 35 mm FF lens
      • Good 60 mm lens on IQ3-100
      • Good 63 mm MF lens
      • Good 65 mm FF lens
      • Good 85 mm FF lens
      • Good and bad 25mm FF lenses
      • Good zoom at 24 mm
      • Marginal 18mm lens
      • Marginal 35mm FF lens
      • Mildly problematic 55 mm FF lens
      • OK 16-35mm zoom
      • OK 60mm lens on P1 P45+
      • OK Sony 600mm f/4
      • Pretty good 16-35 FF zoom
      • Pretty good 90mm FF lens
      • Problematic 400 mm FF lens
      • Tilted 20 mm f/1.8 FF lens
      • Tilted 30 mm MF lens
      • Tilted 50 mm FF lens
      • Two 15mm FF lenses
    • Found a problem – now what?
    • Goals for this test
    • Minimum target distances
      • MFT
      • APS-C
      • Full frame
      • Small medium format
    • Printable Siemens Star targets
    • Target size on sensor
      • MFT
      • APS-C
      • Full frame
      • Small medium format
    • Test instructions — postproduction
    • Test instructions — reading the images
    • Test instructions – capture
    • Theory of the test
    • What’s wrong with conventional lens screening?
  • Previsualization heresy
  • Privacy Policy
  • Recommended photographic web sites
  • Using in-camera histograms for ETTR
    • Acknowledgments
    • Why ETTR?
    • Normal in-camera histograms
    • Image processing for in-camera histograms
    • Making the in-camera histogram closely represent the raw histogram
    • Shortcuts to UniWB
    • Preparing for monitor-based UniWB
    • A one-step UniWB procedure
    • The math behind the one-step method
    • Iteration using Newton’s Method

Category List

Recent Comments

  • Brian Olson on Fuji GFX 100S exposure strategy, M and A modes
  • JimK on Picking a macro lens
  • JimK on Picking a macro lens
  • Glenn Whorrall on Picking a macro lens
  • JimK on What pitch do you need to scan 6×6 TMax 100?
  • Hatzipavlis Peter on What pitch do you need to scan 6×6 TMax 100?
  • JeyB on Internal focusing 100ish macro lenses
  • JimK on How focus-bracketing systems work
  • Garry George on How focus-bracketing systems work
  • Rhonald on Format size and image quality

Archives

Copyright © 2023 · Daily Dish Pro On Genesis Framework · WordPress · Log in

Unless otherwise noted, all images copyright Jim Kasson.