This is part of a long series of posts about the Sony a6300. The series starts here.
In the post before the last one, I showed a kink in the noise vs ISO setting curve for the a6300 that occurred at high ISO I suspected digital signal processing, specifically, low-pass filtering.
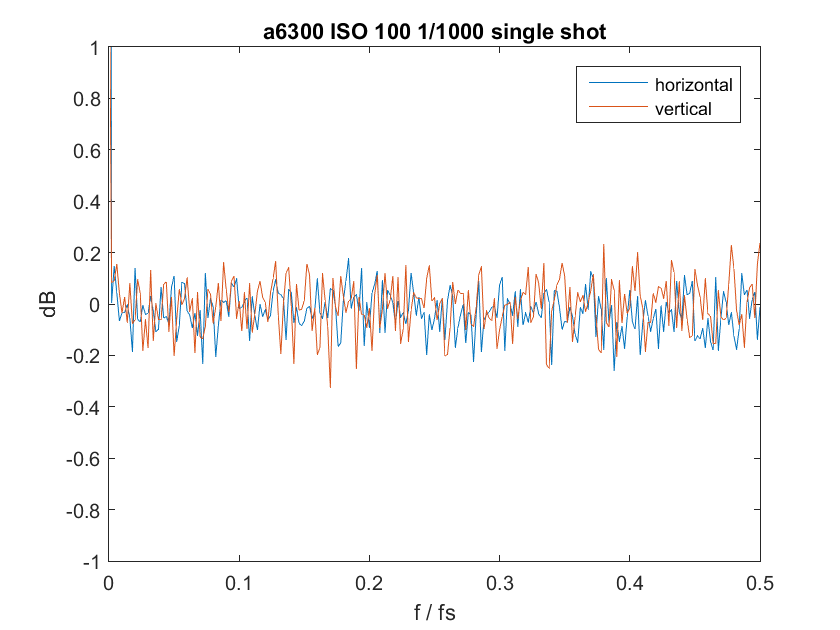
The way to detect this is to look at the frequency response of the read noise. If it’s flat (except for some thermally related stuff near dc) then the camera’s firmware has — quite properly, IMO — kept its mitts off the raw data, at least with respect to filtering.
I looked at the red raw channel for the single shot case. Here’s a baseline, at ISO 100.
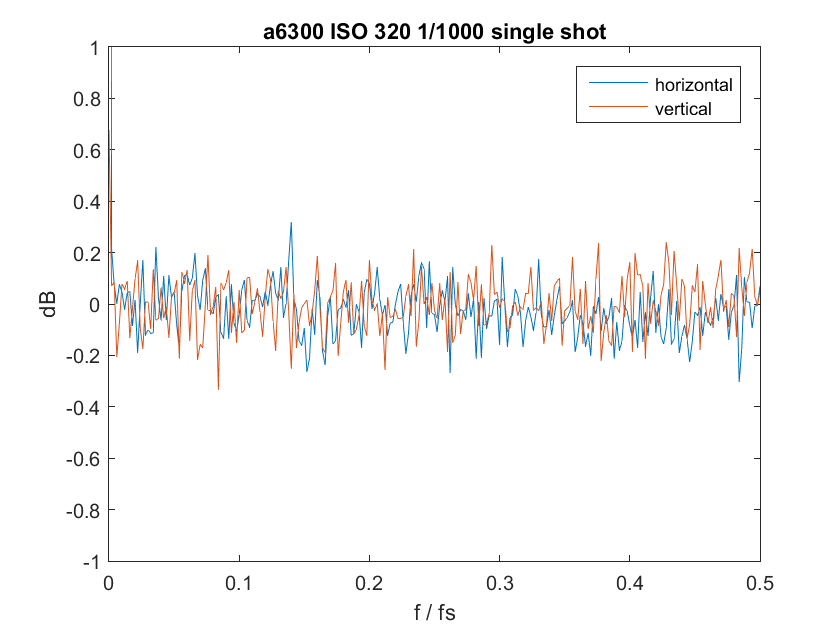
Nice and flat. Now let’s look at ISO 430, right before the conversion gain switch takes place.
Still flat. Now 400:
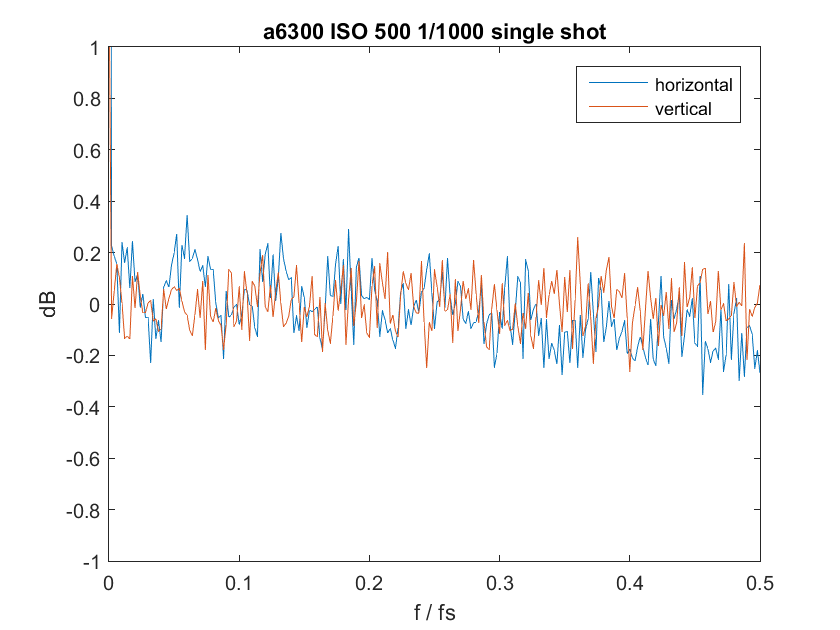
That’s funny. There’s a very slight drop-off with frequency in the horizontal plane. I have no idea waht causes that.
ISO 500:
Still a little bit of droop.
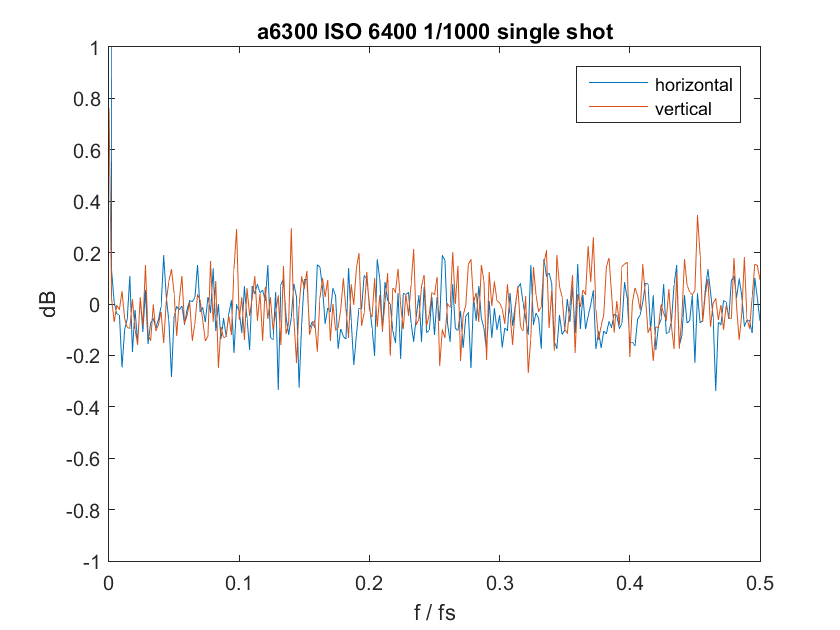
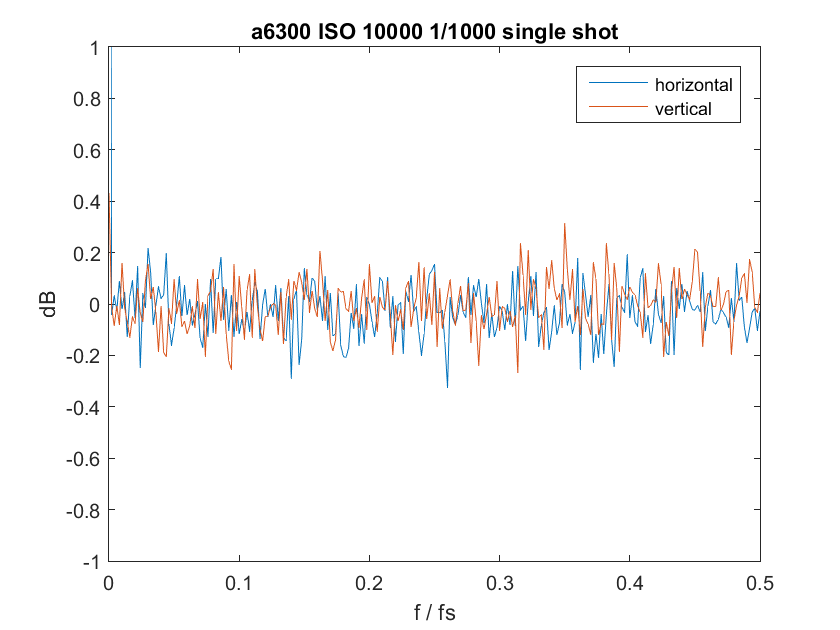
ISO 6400 is looking flat.
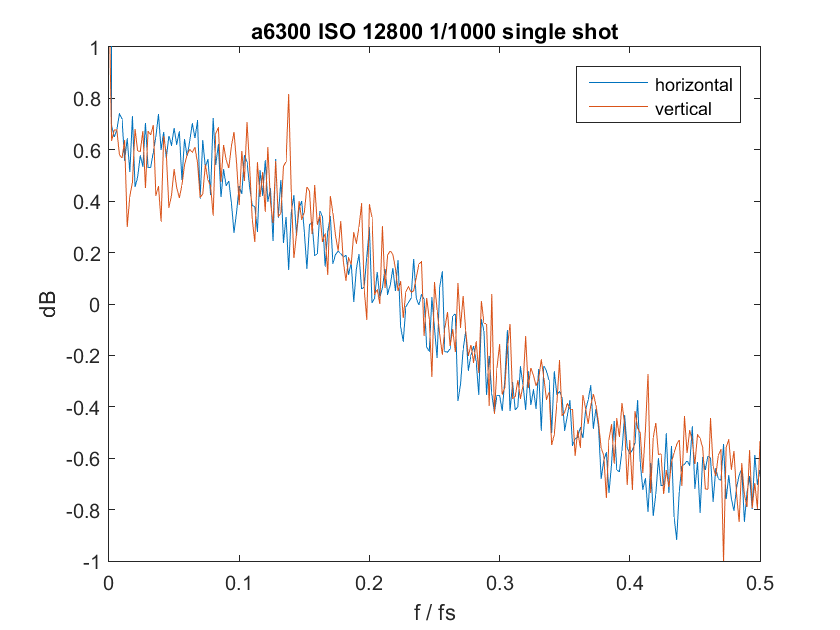
So is ISO 10000. What about ISO 12800? That’s where we saw the suspicious drop in the noise curves.
There it is. The smoking gun.
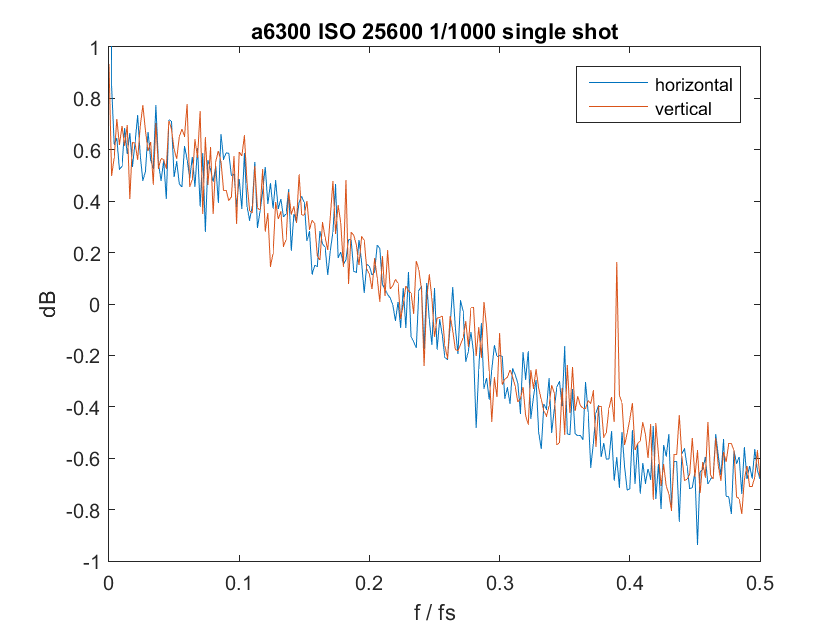
Does it persist that way at higher ISOs?
Indeed it does.
Jim, are the frequency plots off a single raw channel or some combination of all four?
The red channel, Jack. I’ll go back and make that clear. Thanks.
Jim
Not to be a neatpeak, but you got typo here in text and chart also makes it tough to understand actual data “ISO 430” is “ISO 320” and chart you posted for ISO 400 is same as ISO 500.